Key Takeaways
How much money flowed into Ethereum ETFs recently?
On 24 November, ETH ETFs saw $96.6 million in inflows, with BlackRock contributing $92.6 million. On 25 November, ETH ETFs added another $78.6 million.
What do technical indicators say about Ethereum right now?
RSI and MACD point to a short-term bearish trend, but these signals may be temporary noise rather than long-term weakness.
At a time when the market is buzzing with new altcoin ETF launches, Ethereum’s quiet yet powerful momentum is being overlooked.
The world’s largest altcoin ETF – the Ethereum Spot ETF – has been steadily gaining strength ever since it debuted in the same year as the historic Bitcoin [BTC] ETF rollout.
And the latest numbers show that investor confidence in Ethereum [ETH] is far from fading.
Ethereum ETF inflows analysis
On the 24th of November, Ethereum Spot ETFs logged a strong $96.6 million in net inflows, with BlackRock alone accounting for $92.6 million, marking its first inflow in two weeks.
Well, the momentum didn’t stop there.
A day later, ETH ETFs attracted another $78.6 million, led by Fidelity’s FETH with $47.5 million, followed by BlackRock’s ETHA at $46.2 million, and Grayscale’s ETH adding $8.3 million.
While most other issuers recorded zero activity, Grayscale’s ETHE continued to face pressure, witnessing $23.3 million in outflows, according to Farside Investors.
However, despite the strong inflows into Ethereum ETFs, the asset itself continues to battle a difficult price environment.
ETH price action
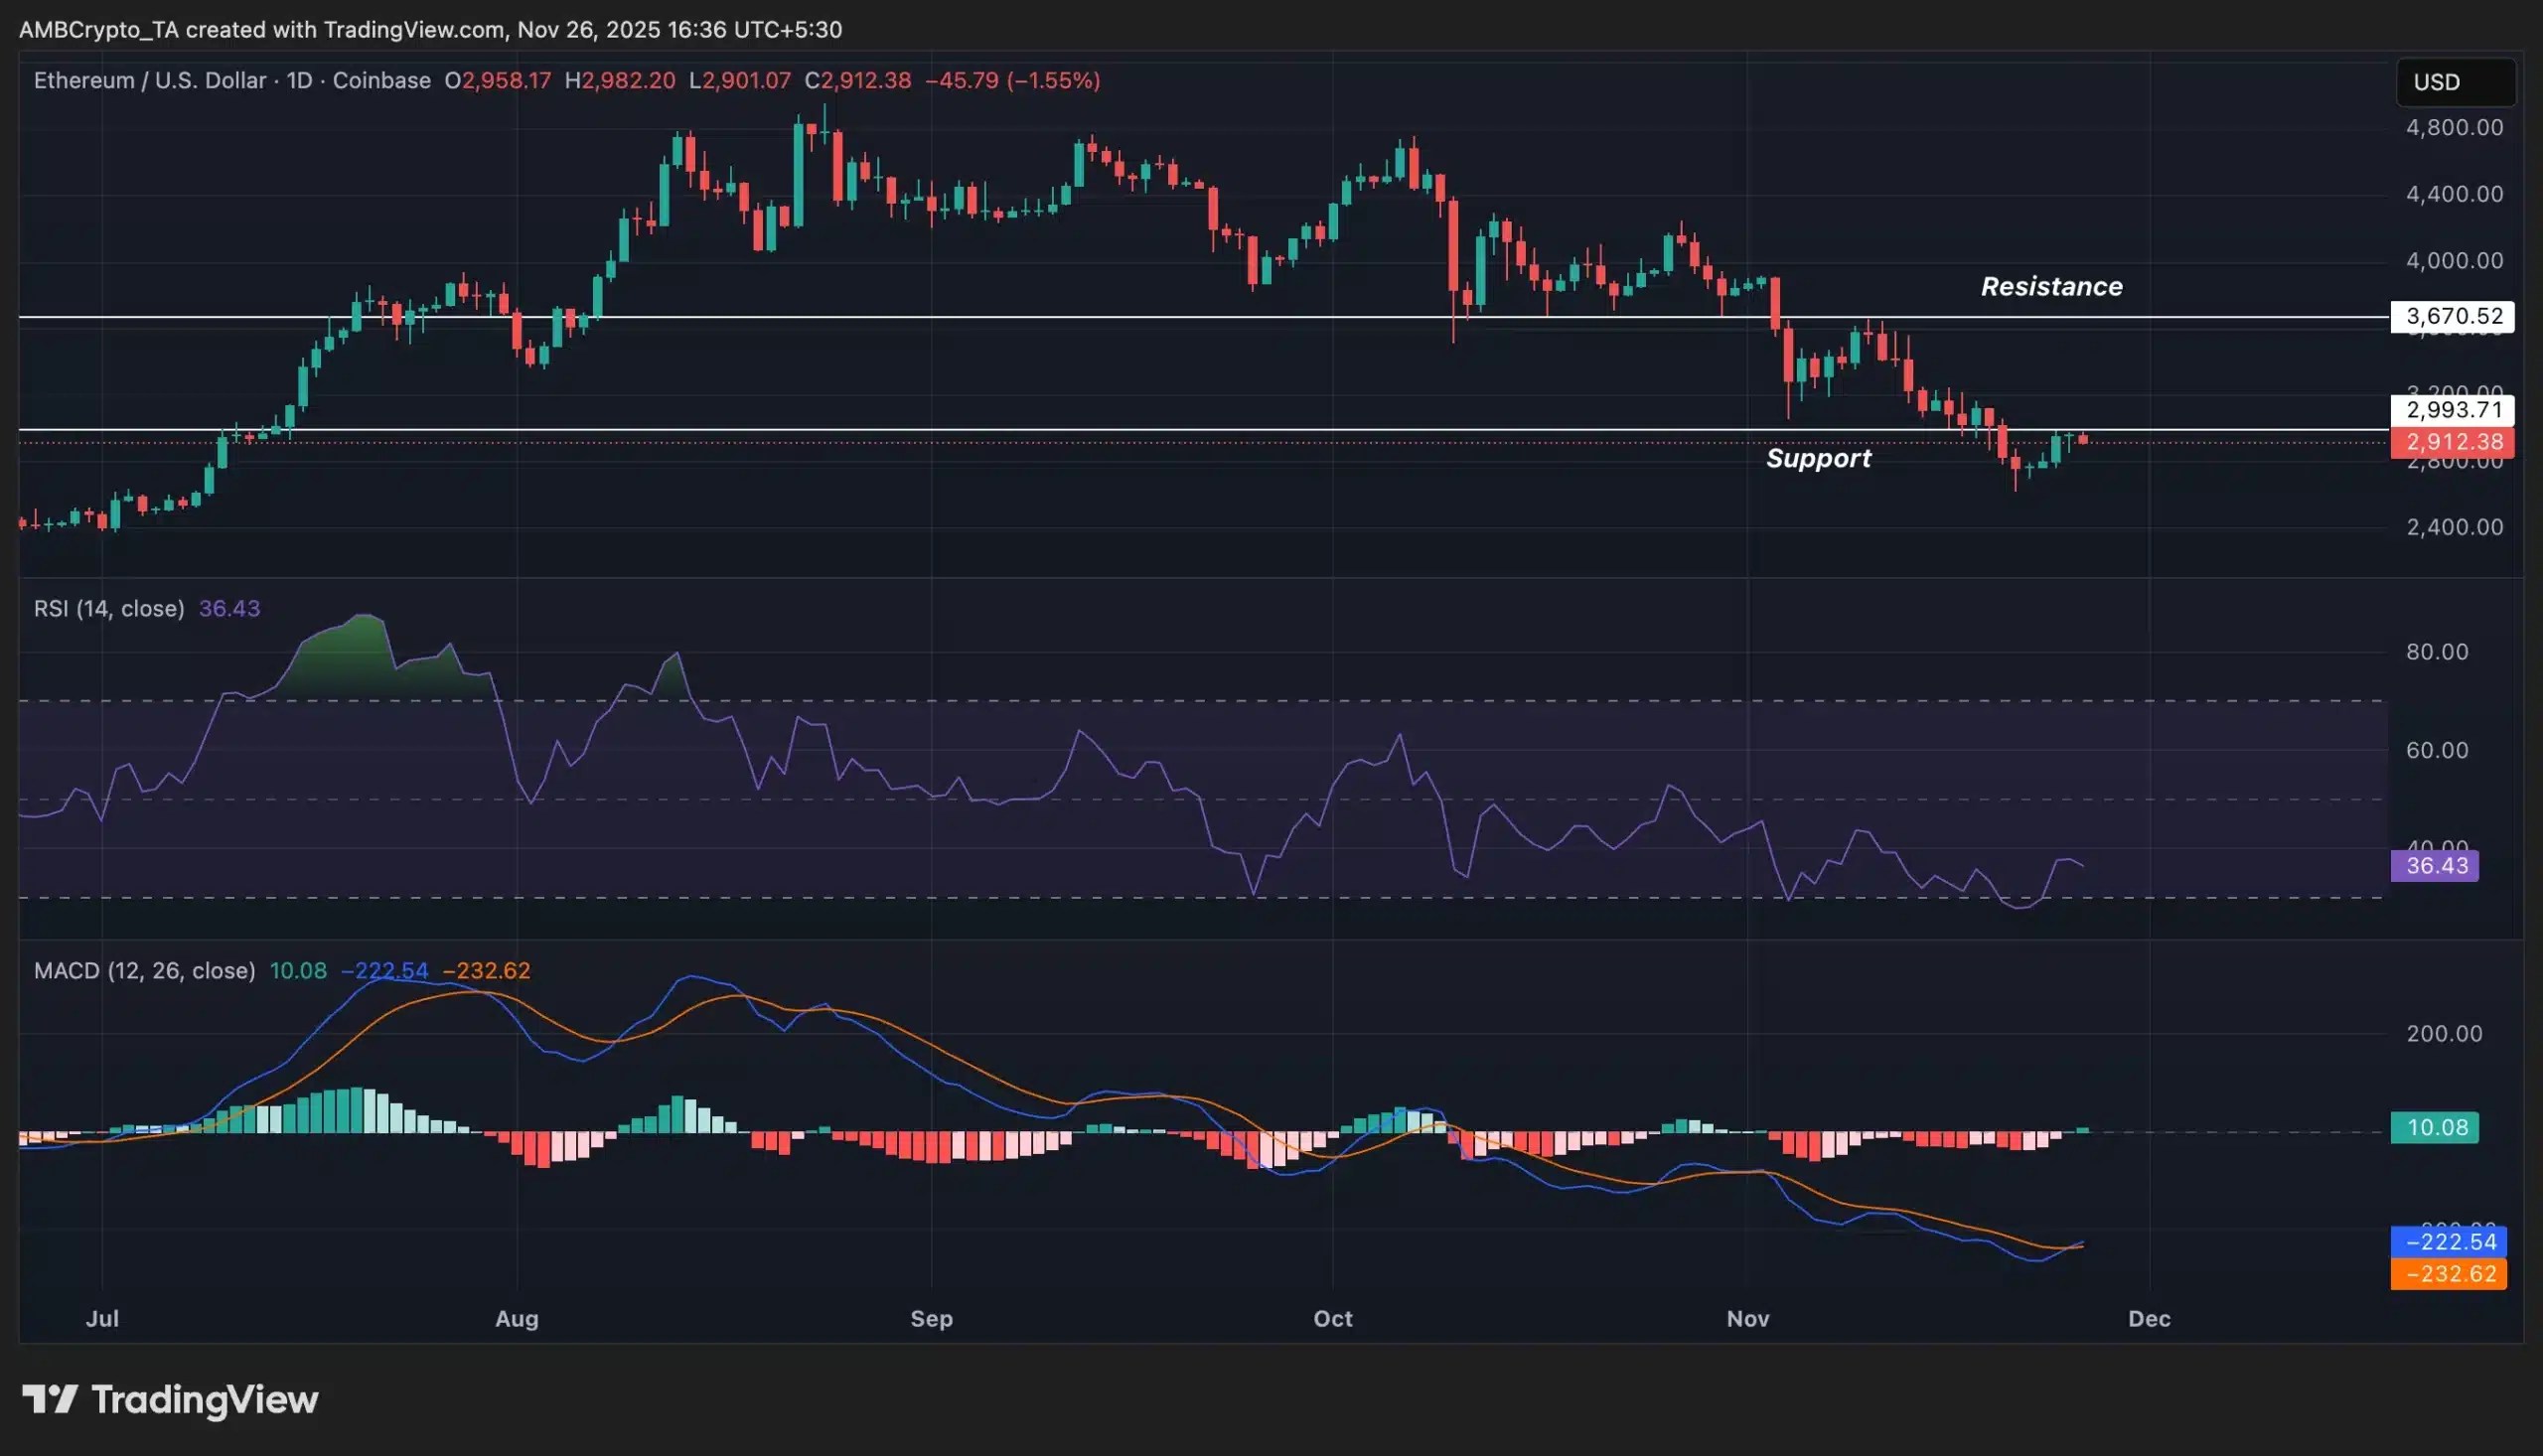
At the time the latest ETF inflows were recorded, Ethereum was trading around $2,913.41, still unable to reclaim the $3,000 mark after falling more than 30% in a month, according to CoinMarketCap.
This weakness stood in sharp contrast to the asset’s price action when ETH ETFs first went live on the 23rd of July 2024, when Ethereum closed at $3,418.61.
But the current struggle isn’t about Ethereum alone.
The broader crypto market has been under pressure due to a mix of macro events, including a U.S. government shutdown, shifting expectations around Fed rate cuts, and overall risk-off sentiment.
Technical indicators also reflect this short-term turbulence. In fact, the RSI and MACD point toward a bearish phase, though these signals could be temporary noise rather than signs of a deeper structural shift.


Source: Trading View
Interestingly, this period of weakness has actually pulled major Ethereum whales back into the market. After ETH rebounded nearly 9% from its recent low of $2,623, whales became noticeably active again, breaking a month-long downtrend.
On-chain data showed dormant wallets suddenly moving large amounts of ETH.
Binance ETF also picks up
Now, while Ethereum battles its own volatility, the broader ETF race is heating up.
In a fresh development, VanEck has filed for a Spot Binance [BNB] ETF. According to recent SEC filings, the VanEck BNB ETF (VBNB) will list on Nasdaq and hold BNB directly, tracking the MarketVector BNB Index.
The fund will not enable staking at launch, though VanEck noted that any future staking features would be handled through third-party providers with prior notice.
This announcement landed just as BNB traded at $857.52, posting a mild 0.57% gain in 24 hours but still down more than 25% over the past month, a pattern driven by the same macro pressures affecting Ethereum and the rest of the crypto market.
Source: https://ambcrypto.com/ethereum-etfs-pull-175mln-in-two-days-yet-eth-stays-weak-whats-wrong/