ETH, the native cryptocurrency of the Ethereum blockchain, showed a sharp bounce of 3.11% on Tuesday, July 8, 2025. The buying pressure gains its momentum from broader market upticks, whale accumulation, and strong demand pressure at close support. As the technical chart of ETH shows a traditional reversal pattern, the coin price is poised for a major breakout.
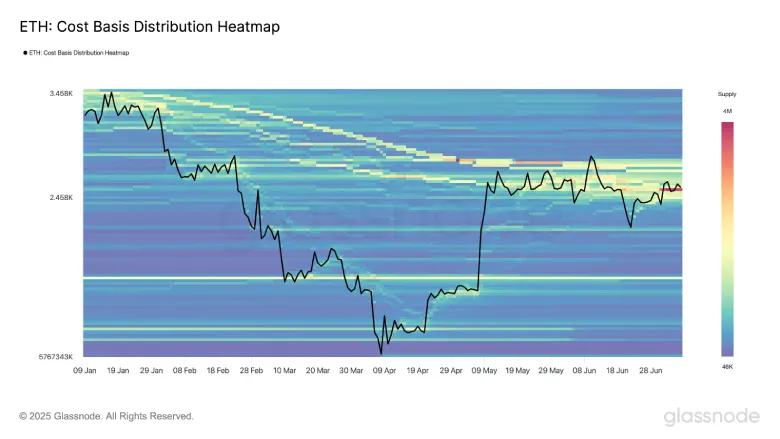
Ethereum Cost Basis Heatmap Highlights $2.5K as Key Accumulation Zone
Since last weekend, the Ethereum price has been hovering above the $2,500 psychological level as the broader market showcased a lack of bullish momentum. While several other altcoins faced bearish reversal during this uncertain period, the ETH price held steady above the aforementioned level.
ETH’s Cost Basis Distribution Heatmap hints that the $2.5k support stands as the strongest accumulation zone in months. According to Glassnode data, over 3.45 million ETH have a cost basis in the $2,513–$2,536 range, indicating a massive concentration of supply is defending this level.

Adding to the bullish note, the crypto whale continues to accumulate ETH despite sideways action. According to blockchain tracker Lookonchain, a wallet related to Cumberland, withdrew 13,100 ETH (worth approximately $33.58 million) from the Binance exchange earlier today.


The presence of strong support and whale accumulation bolsters the Ether price to resume its prevailing recovery trend.
ETH Price Gives Bullish Breakout From Reversal Pattern
Over the past two weeks, the Ethereum price has shown a strong rebound from the $2,115 low to the current trading price of $2,614, accounting for a 23.65% increase. Amid this recovery, the coin price showed a slight dip to $2,387, which validated the rise of buying pressure at a discounted price as the price shot immediately to the $2,600 region, displayed in the 2nd July candle.
With an intraday surge of 3% today, the ETH price shows a bullish breakout from the overhead resistance of $2,613. The level coincides closely with the neckline resistance of an inverted head-and-shoulder pattern. This chart setup is made up of three dips—two similar-sized “shoulders” and a deeper “head” in the middle, indicating a shift from bearish to bullish momentum post-breakout.


If the breakout is sustained, the coin price could rally nearly 10% to hit the $2,865 mark, followed by an extended leap to $3,120.
Also Read: Bitcoin Drops 10% After Failed Breakout from Bullish Pattern
Source: https://www.cryptonewsz.com/ethereum-cost-basis-support-2-5k-price/