- Ethereum’s exchange netflows on derivative exchanges fell below -400,000 ETH
- CME ETH Futures Open Interest chart revealed a decline from $3,216.66M to $3,251.98M over 16 hours
Ethereum’s exchange netflows on derivative exchanges recently fell below -400,000 ETH, coinciding with Bitcoin miner underpayment – A sign of market stress. These developments, together, hinted at a significant ETH withdrawal from exchanges. Such a development is historically linked to a fall in selling pressure and a hike in bullish sentiment across the market.
A possible recovery on the charts?
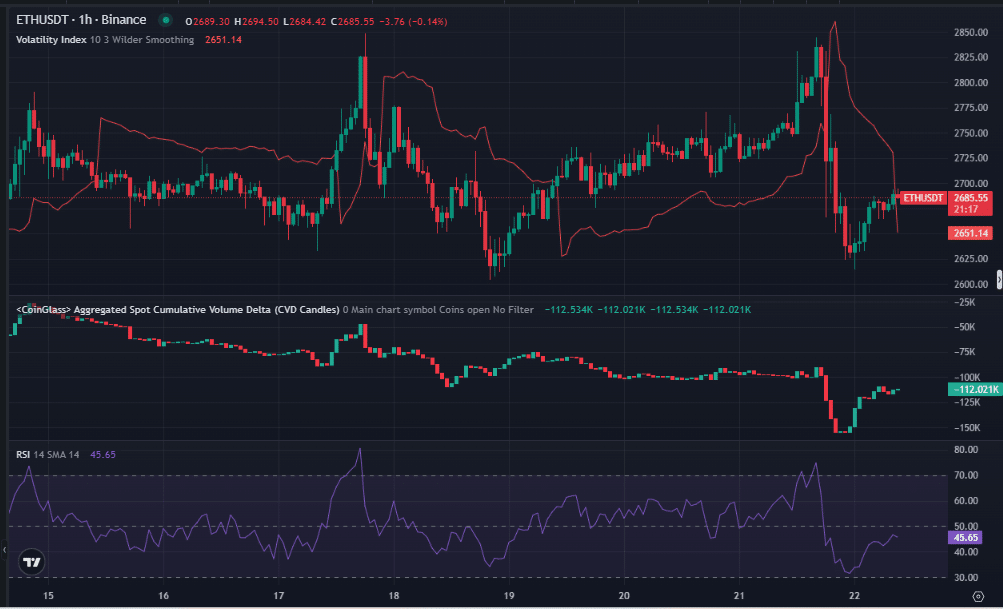
An analysis of the 1-hour ETH/USD chart on Binance saw ETH trading at around $2,685.55, following a fair recovery over the last 72 hours. Worth noting, however, that the Bybit hack could still have some impact on the altcoin’s value.


Source: CoinGlass
The Relative Strength Index’s (RSI) position alluded to neutral to oversold conditions across the market – A sign of potential buying pressure. Historically, similar RSI levels have preceded price rebounds, supporting reduced selling pressure after major outflows.
Also, the Aggregated Cumulative Volume Delta (CVD) at -112.02k reflected strong selling dominance. However, as the price bottomed, accumulation by strategic traders was seen too. These signals aligned with a bullish shift, reinforcing a possible move above $2,800 as traders adjusted their positions.
A bullish accumulation signal
Ethereum’s three-month exchange netflows chart highlighted negative outflows of -191.96K ETH, with peak outflows seen very recently.


Source: IntoTheBlock
Usually, such major outflows imply a fall in selling pressure, as investors shift assets into cold storage. The price reaction near $2,730, followed by a decline to $2,529, reflected an anticipated market consolidation phase.
Miner underpayment stress further indicated supply-side reductions, setting the foundation for a rebound as selling activity weakened.
Market positioning for the next move
Furthermore, an analysis of the CME ETH Futures Open Interest showed a decline from $3,216.66M to $3,251.98M over 16 hours.


Source: CoinGlass
It was trading $2,736.79 at press time, with the drop in Open Interest signaling reduced speculative activity. A similar pattern in mid-2024 preceded price recoveries, aligning with the idea of market positioning before a potential move.
Lower Open Interest is often a sign of profit-taking or leverage reductions. This might also hint at market stabilization, before a rebound driven by improving sentiment and reduced selling pressure.
A prelude to a price surge?
The 1-hour ETH/USD Volatility Index, smoothed over 10 periods, stood at 26.61. Over the last 16 hours, volatility spiked during the sell-off to $2,618.17, stabilizing afterwards.
This pattern signaled market uncertainty, but the reduced volatility seemed to be in line with historical post-outflow consolidations.
Holder confidence remains strong amid market stress
Finally, the Global In/Out of the Money showed 107.13M ETH in the money (75.06%), 24.24M ETH out of the money (16.98%), and 11.35M ETH at the money (7.95%), with ETH trading at $2,686.24.


Source: IntoTheBlock
A dominant in-the-money Ethereum supply is a sign of holder confidence, reducing sell-off risks. The out-of-the-money demographic hinted at resistance zones, but overall, the structure pointed towards potential upside as miner underpayment pressure eased.
These distributions resembled past bullish recoveries, supporting the thesis of accumulation after large outflows.
Source: https://ambcrypto.com/all-about-ethereums-latest-market-shift-and-what-it-means-for-the-price/