Tezos price analysis is bullish, with the XTZ/USD pair rising to the $1.53 level. However, the digital asset is facing resistance and may pull back to test support at $1.44. The price action recently created a bullish engulfing candlestick pattern, which indicates that the bears are losing control. Resistance for the XTZ/USD is present at $1.54, a breakout above this level could see Tezos target the next resistance level at $2.00. On the other hand, a failure to move past $1.54 may see the price pull back to test support at $1.44.
The trading volume has increased over the last 24 hours to retrace to $27,223,665, Therefore, the bulls need to be careful as a bearish move could invalidate the bullish trend, the Tezos price is currently in a breakout zone and a move in either direction could set the tone for the next move. The market cap for the Tezos price is currently at $1,392,188,715.
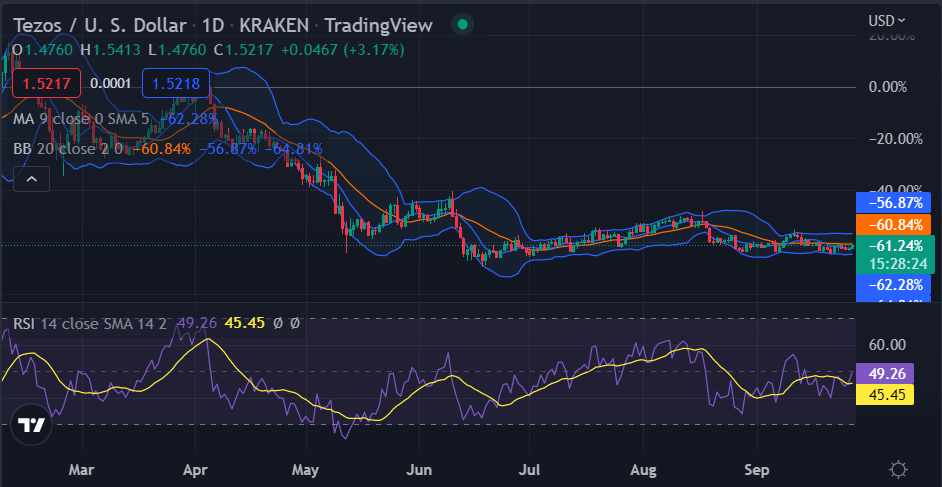
XTZ/USD 1-day price chart: Bulls continue to dominate as Tezos price nears $1.53
The one-day Tezos price analysis is going in the bullish direction again after a successive downtrend. The price has increased up to $1.53 today which can be considered a huge accomplishment for the cryptocurrency as it has gained a value of 4.60 percent during the last 24 hours. Further advancement is to be expected as the bullish momentum is strengthening with each passing day. Other important indicators include the moving average (MA) which is settled at the $1.2 position for the day.

As the volatility has decreased during the past few days, the Bollinger bands values have changed as well. Now, the upper value is placed at $1.54 representing the resistance, while the lower value is found at $1.4 representing the support. The Relative Strength Index (RSI) score has increased as well and has moved up towards an index of 45.45 and the curve is still upwards hinting at the buying practice in the market.
Tezos price analysis: Recent developments and further technical indications
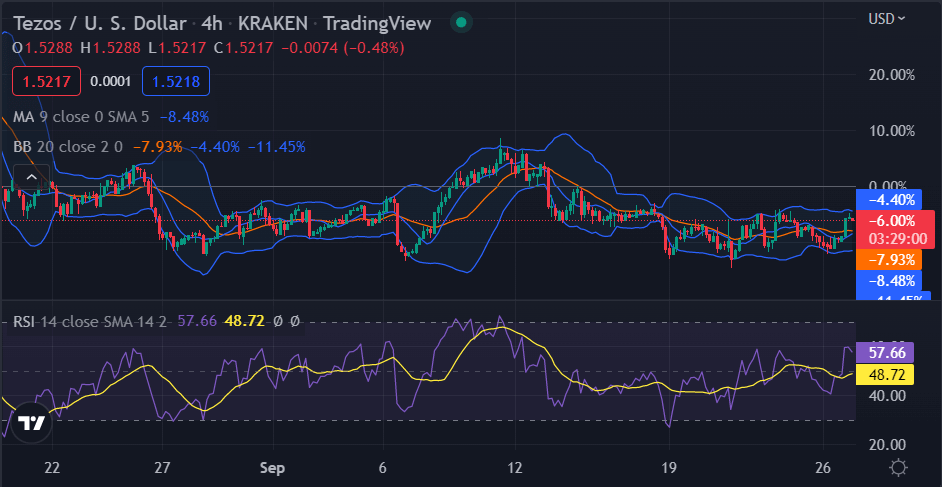
The 4-hour Tezos price analysis is following the bullish trend as well, as the price has upgraded again. The price levels are going up after dodging past the correction that took place in the past few hours. Currently, the price is settled at the $1.53 mark and is expected to go a bit up from here towards a much better position, as Bollinger bands have expanded. The moving average is still quite low if compared to the price as it is present at $1.52 but it is also on an increasing trend.

The volatility is on the increasing side as the upper Bollinger band has traveled up to $1.52 and the lower Bollinger band has traveled down to $1.41. The RSI score increased as well because of the uptrend and has reached an index of 48.72 and the slope is steeply upwards.
Tezos price analysis conclusion
Tezos price analysis suggests the price is going high today as it has shot past the upper limit of the volatility indicator on the 4-hour char during the last 4 hours. The price has improved significantly if we compare it with the last week’s statistics. There are further chances of recovery for the bulls and the price may break past the $1.54 crucial resistance.
Disclaimer. The information provided is not trading advice. Cryptopolitan.com holds no liability for any investments made based on the information provided on this page. We strongly recommend independent research and/or consultation with a qualified professional before making any investment decisions.
Source: https://www.cryptopolitan.com/tezos-price-analysis-2022-09-27/
