VeChain price analysis shows that the VET/USD pair is currently in a bullish trend. The pair has formed higher highs and higher lows, indicating that the bulls control the market. The price is now facing resistance at the $0.02342 level. If the bulls can break this resistance, they will likely target the $0.02380 resistance level, While support for the pair is at $0.02273, which is the previous low, a break below this level could signal a bearish trend reversal.
The VET/USD pair is currently trading at a critical junction and a break of either the $0.02242 resistance or the $0.02273 support could signal a trend reversal. The digital asset is up by 1.16 percent over the past 24-hour period and is currently trading at $0.02325.
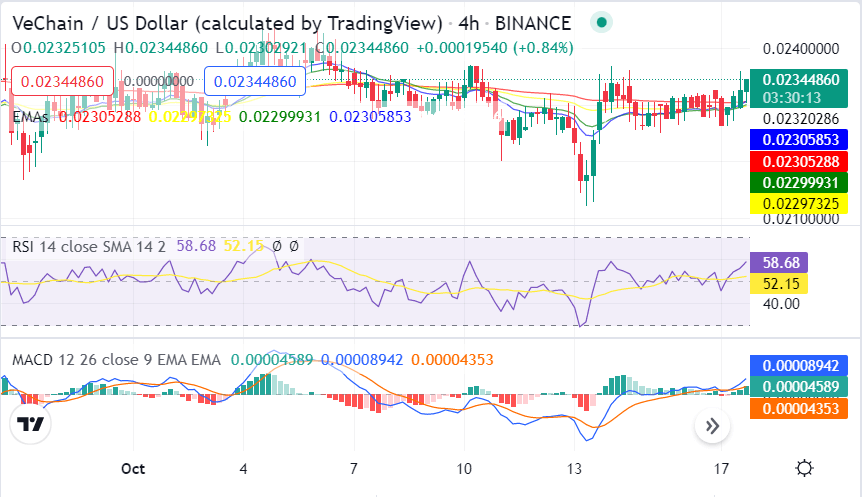
VeChain price analysis on a 4-hour price chart: Upside momentum gathers pace
Looking at the hourly chart for the VeChain price analysis, we can see that the price has formed an ascending triangle pattern. This is a bullish pattern that forms when the price is trading between two horizontal resistance and support levels. The ascending triangle patterns are considered to be bullish patterns as they indicate that the bulls are in control of the market.

The 50-day exponential moving average (EMA) is currently providing support for the price and the 10-day exponential moving average (EMA) has crossed above the 50-day EMA, indicating that the bulls are in control of the market momentum. The Relative Strength Index (RSI) is currently trading at 52.15, which indicates that the market is in a bullish zone. The bulls are in control of the market as the MACDline is currently above the signal line.
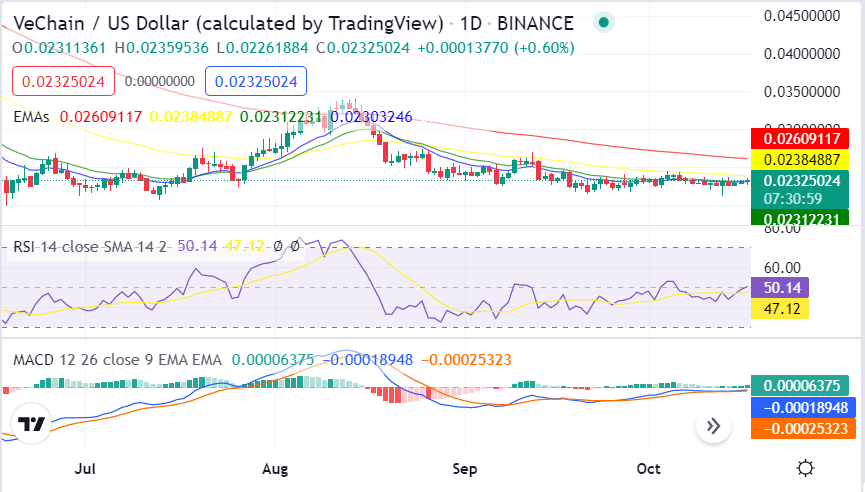
VET/USD 24-hour price chart: Bulls continue to dominate as Vechain price nears $0.02325
The Daily VeChain price analysis shows that the price has been trading between the $0.02273 support and the $0.02342 resistance for the past few hours. The bears have been trying to push the price below the $0.02273 support, but they have been unsuccessful so far. The bulls need to break the $0.02342 resistance to resume the uptrend and target the $0.024 level.

On the 24-hour chart, we can see that the Moving average convergence divergence (MACD) is bullish, as the MACD line is currently above the signal line. The Relative Strength Index (RSI) is currently above 47.12, which indicates that the market is in a bullish zone. The 50 EMA and 10 EMA are both currently providing support for the price.
Vechain price analysis
In conclusion, VeChain price analysis shows that the bulls are in control of the market as they have been able to push the price higher after each dip. The investors need to wait for the price to break the $0.02342 resistance before entering a long position. The bulls are likely to target the $0.024 level if they can break the $0.02342 resistance level. The overall technical indicators are currently signaling a bullish trend.
Disclaimer. The information provided is not trading advice. Cryptopolitan.com holds no liability for any investments made based on the information provided on this page. We strongly recommend independent research and/or consultation with a qualified professional before making any investment decisions.
Source: https://www.cryptopolitan.com/vechain-price-analysis-2022-10-17/
