Tezos price analysis is indicating a decrease in price as the bears have made a comeback once again. The trend line was upward for the past few days, but today, it proved extremely discouraging for the market as the bears are in a dominant position and have brought humongous losses in just a matter of a few hours as they have downgraded the price to $1.47.
Resistance is currently present at the level of $1.47, and if not broken through, XTZ will likely continue to decrease in price, while the support level is at $1.42. Today the situation is quite worrisome as the cryptocurrency is struggling to find support, but as the bearish momentum is growing, improvement in price seems impossible today.
Tezos price analysis 1-day price chart: XTZ devalues down to $1.43 level
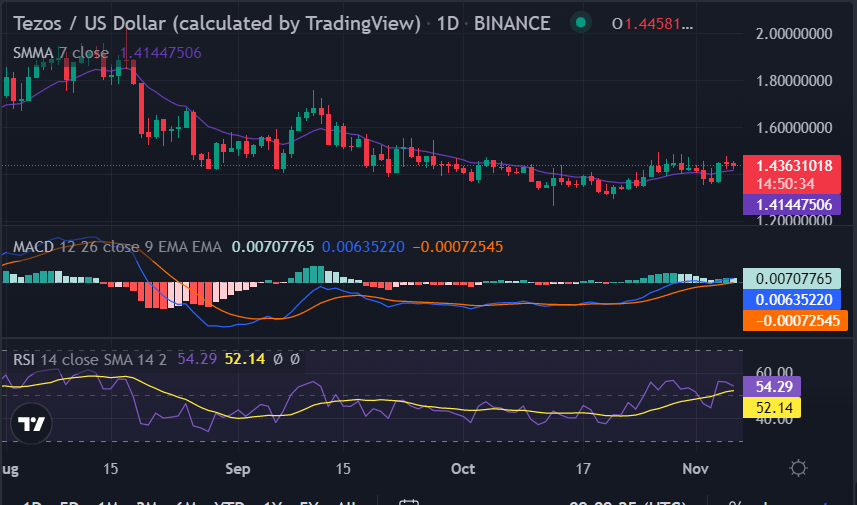
The one-day Tezos price analysis is going in the bearish direction again after a successive downtrend. The price has decreased up to $1.43 today, which is quite a loss for cryptocurrency as it has lost 1.05 percent value during the last 24 hours. The 24-hour trading volume has also seen a decrease as it currently stands at $43 million, and a market cap of $1.31 billion for XTZ/USD. Further decrease in price levels is to be expected as the bearish momentum is strengthening with time.

The 50 SMA line is below the 200 SMA line, indicating that the path of least resistance for XTZ/USD will be downwards. Currently, it looks like the bears are in control and if the support levels are not able to hold, we can see a further decrease in Tezos price. The MACD indicator is decreasing, and the signal line is below the MACD line, pointing towards a bearish trend in XTZ/USD. The RSI indicator is at 52.14, indicating that the market is in bearish territory and XTZ is oversold.
Tezos price analysis: Bearish momentum pulls the price back to $1.43
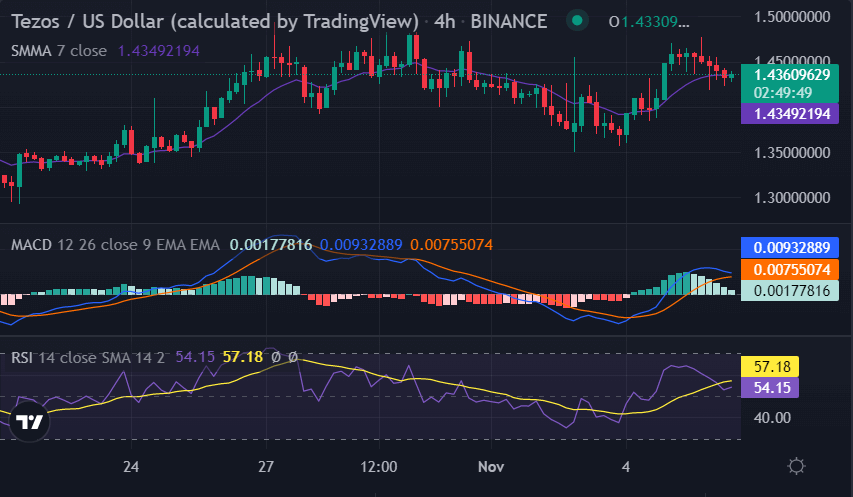
The 4-hour Tezos price analysis is following the bearish trend as well as the price continues to cover the range downwards. The price levels are going down after being on a bearish trend for the last four hours and have reduced rapidly. Currently, the price is settled at the $1.43 mark and is expected to go further down from here as no bullish support has been observed yet.

The MACD indicator on the 4-hour XTZ/USD chart is also following the bearish trend as the MACD histogram and the signal line are both below the zero line. The RSI indicator is also in the bearish territory at 57.18, indicating that XTZ/USD may continue to decrease in value. The SMA 50 is at $1.44 and the SMA 200 is at $1.46, both pointing towards a bearish trend in the market.
Tezos price analysis conclusion
The Tezos price analysis suggests the price is going down today as it has reached the $1.43 level during the last 4 hours. The price has decreased notably in just a few hours which seems like another market crash. The bullish may come back and bring some positivity to the market, but for now, it is the bearish momentum that is dominating.
Disclaimer. The information provided is not trading advice. Cryptopolitan.com holds no liability for any investments made based on the information provided on this page. We strongly recommend independent research and/or consultation with a qualified professional before making any investment decisions.
Source: https://www.cryptopolitan.com/tezos-price-analysis-2022-11-06/
