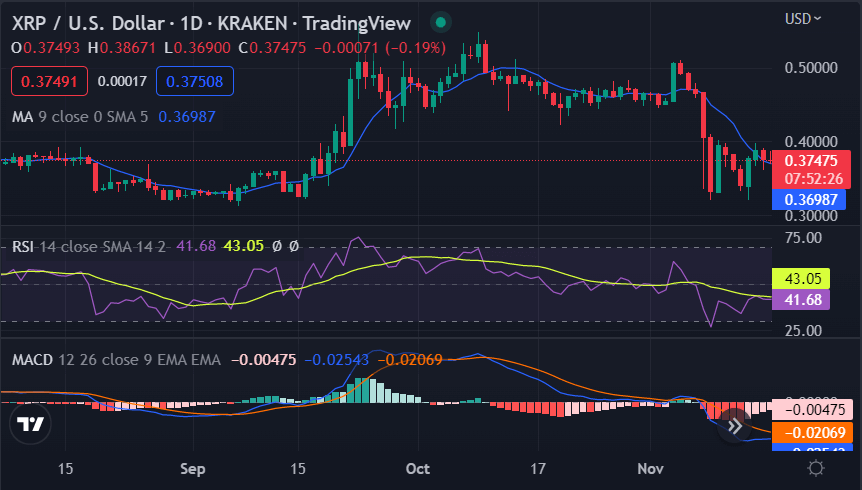
In today’s Ripple price analysis, bulls have made a return on the price chart as a rise in price has been detected. The situation has been favorable for the buyers as the price has been covering an upwards range today. A steady decline in price levels was observed for the past few days, but the circumstances are different now, and the price function is in the bulls’ control today. The upward movement of the price action has resulted in it reaching $0.3769 in the last 24 hours. However, selling pressure has arisen again, as the price is under correction at the moment.
XRP/USD 1-day price chart: Bulls strive for the lead as price levels show recovery
The 1-day price chart for the Ripple price analysis gives the lead to the buyers to secure their winning position as the price has increased up to $0.3739 today. In the past few days, a considerable level of depreciation in the coin’s value has been reported as the price has decreased notably over the past week. The losses have been considerable, but now a chance for recovery has arisen. The price is up by 2.30% in the last 24 hours, with a market cap of $18.95 billion, and a trading volume of $1.35 billion in the last 24 hours.

Meanwhile, if we talk about the moving average value in the 1-day chart, then it is found resting at the $0.3649 level, which is acting as a strong resistance for the XRP/USD pair. The RSI indicator is moving in an upward direction, and it has reached the 43.05 level. The MACD line is moving in a sideways manner, while it resides close to the positive value of 0.0007.
Ripple price analysis 4-hour price chart: XRP/USD retraces from highs as bulls take a breather
The 4-hour price chart for Ripple price analysis shows the other side of the picture, as the uptrend seen on the 1-day price chart has undergone a reversal, as a downturn in price has been observed during the last 24 hours. The bears have made a comeback again in the past few hours and have been degrading the coin value continuously. The cryptocurrency has been devalued back to $0.3769 after the trends underwent a different shift recently. However, the balance of power is still on the bullish side as the price is still trading on the upper side.

The moving average (MA) is also at a lower height as compared to the current price and is present at $0.3743. The RSI index has increased as well because of the ongoing bullish trend and has gone up to index 52.99 just below the centerline of the neutral zone. The MACD line has crossed over the signal line and is placed in a sideways direction at the moment. This indicates that there could be a forthcoming price correction.
Ripple price analysis conclusion
Ripple price analysis suggests the trend is still bullish overall for today. However, it can be observed that the price has been trading in the lower price envelope of the last previous days, which has affected the coin’s value adversely. The recovery reported today is nominal, and the 24-hour chart shows that the price is still under correction. Therefore, it remains to be seen if XRP/USD can break above the $0.3848 level in the coming hours.
Disclaimer. The information provided is not trading advice. Cryptopolitan.com holds no liability for any investments made based on the information provided on this page. We strongly recommend independent research and/or consultation with a qualified professional before making any investment decisions.
Source: https://www.cryptopolitan.com/ripple-price-analysis-2022-11-17/
