The latest Polkadot price analysis shows signs of a strong downtrend, as the price curve shows a downward movement for the day. In the previous day, the market has been ruled by bulls, but the overall market sentiment has been bearish. The current price of DOT is $6.26, which is slightly lower than that yesterday’s closing price. More selling activity is seemingly taking place, and it is expected that further loss is on its way.
The bullish trend line is in place, but the resistance of $6.64 is hindering upward price movement. A break above this level could bring DOT to a new level and spark a bull run. On the other hand, if the price fails to breach this level, it could lead to further losses and bearish sentiment in the market.
The trading volume for DOT/USD is currently low, indicating that most traders are not actively trading the asset. The market cap of Polkadot is also low, at $7.22 billion. This suggests that there are not enough buyers in the market right now to drive up the price of the coin.
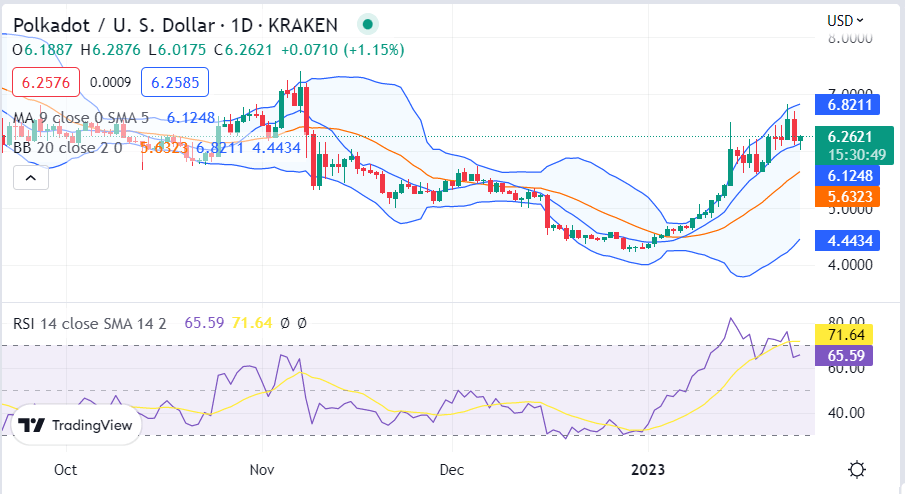
DOT/USD 1-day price chart: Cryptocurrency faces further downside as price falls below $6.64
The bearish trend is taking over the market as Polkadot price analysis value underwent a marked decline in the last 24 hours. This trend is expected to intensify in the coming few weeks, as the selling pressure is getting high. The price is now standing at $6.26 after facing a massive shock today. The moving average (MA) value in the one-day price chart is at a relatively stable position for now, suggesting that the bearish trend will continue in the near future.

The SMA 50 curve is at a relatively greater height than the SMA 20 curve, as the bears have been dominating for a while. If we move towards the Bollinger bands Indicator, its upper band is standing at $6.82, whereas its lower band is standing at $4.44 point. The Relative Strength Index (RSI) score is also quite low and is touching the under-bought limit, i.e.71.64.
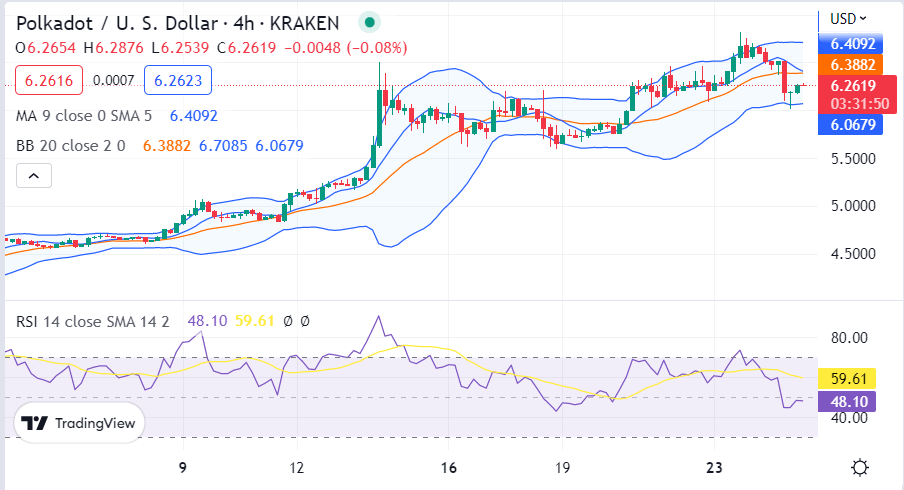
Polkadot price analysis: Price levels collapse below $6.64 after bearish drift
The four-hour Polkadot price analysis indicates a declining trend for the cryptocurrency, as the bears have been maintaining their lead. In the past four hours, the DOT/USD value drastically declined to $6.26 because of ongoing selling pressure. The bearish trend has been consistent for the past few hours and will most expectedly remain strong in the upcoming hours. The four-hour price chart’s moving average is settled at $6.40.

The volatility is increasing, which means that the bearish trend will outstretch in the future. The upper band of the Bollinger bands Indicator is touching the $6.70 mark, whereas the lower band is touching the $6.06 mark. The RSI graph also shows a descending curve, and the score is now 59.61 for DOT/USD.
Polkadot price analysis conclusion
From the above Polkadot price analysis, it can be confirmed that the cryptocurrency is facing a major loss due to the bearish wave. Today, the price underwent a significant decline and has been lowered to $6.26. If the downtrend expands in the upcoming hours, analysts expect a further reduction in coin value.
Source: https://www.cryptopolitan.com/polkadot-price-analysis-2023-01-25/
