The most recent Dogecoin price analysis indicates an increasing trend for the last 24-hour period as the price has been increasing for the second day consecutively. Green candlesticks indicate a reversal in trends due to the bullish turnover. Although the price followed the market’s bearish weekly sentiment, today’s trend has been encouraging for buyers. DOGE/USD now stands at a value of $0.08951, following the latest uptrend.
The market cap for DOGE stands at $11,878,446,510. Over the last 24 hours, the trading volume is $954,587,021 and over 24 hours it is $12,404,727,409, showing a gradual increase in trading activities. The buyers now have an upper hand as the current market trend indicates a bullish trajectory aiming for the $0.09289-level resistance.
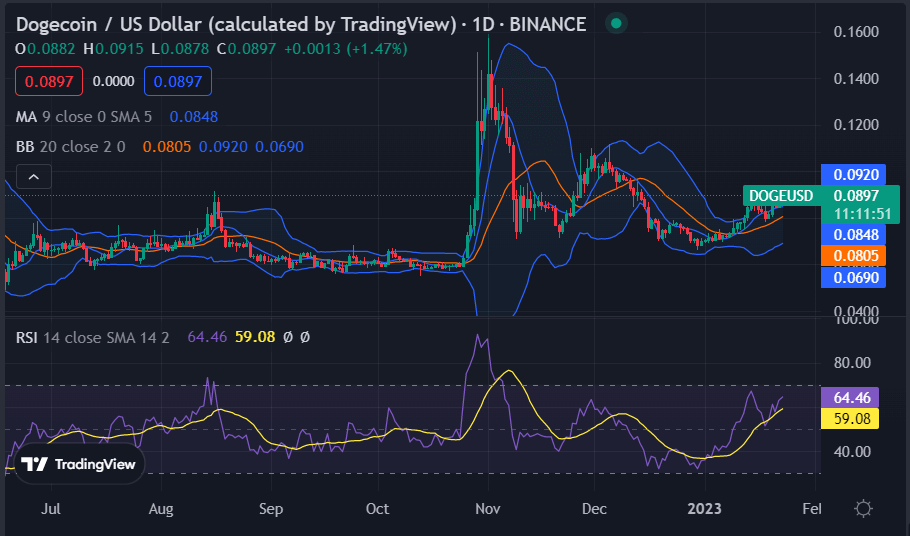
Dogecoin price analysis 1-day price chart: DOGE recovers as the bullish trend continues
The 24-hour Dogecoin price analysis gives a bullish indication regarding today’s price movements. The price showed an upward inclination during the past 24 hours because of the sudden bullish return. Although the bears were winning successively in the previous week as the trend line was downwards, some hours yesterday, the coin rejected further downside, and today, the price recovered up to $0.08951, gaining four percent value over the last 24 hours. Still, the current price stands lower than its moving average (MA) value of $0.08.

The volatility is high, which is a positive signal regarding future market trends, and the price might receive a further bullish boost. Discussing the upper and lower values of the Bollinger bands indicator, the upper band shows a $0.09 value, whereas the lower band displays a $0.06. The Relative Strength Index (RSI) graph presents an ascending curve, and the score has increased to an index of 59.08. The ascending graph of the indicator hints at the buying activity in the market.
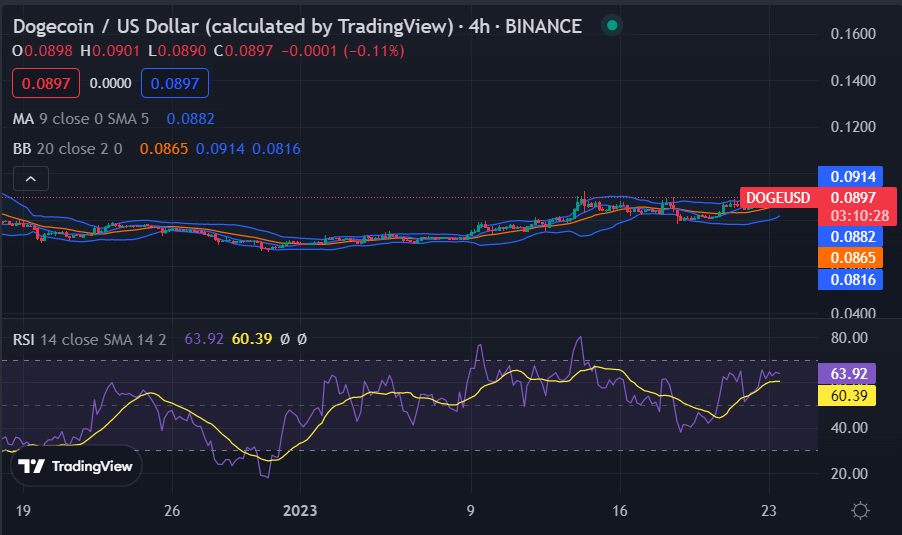
Dogecoin price analysis 4-hour chart: The resistance level is $0.09289 which is the next aim
The 4-hour Dogecoin price analysis shows a strong bullish trend for the market as the buyers have controlled the price flow for the past 24 hours today. Over the larger picture, a series of green candlesticks marks the 4-hour price chart, thus confirming an uptrend. The short-term trending line now confirms the upward price action. The bullish impulse has increased the coin’s value to $0.08951. The moving average value sits at $0.08, and the SMA 20 curve is traveling towards the SMA 50 curve and might cross over it in the coming hours, which will be a further bullish indication.

The Bollinger bands are now making an average of $0.08. At the same time, their upper edge is present at $0.09 high, while their lower edge touches $0.08. Meanwhile, the RSI score has inclined to index 60.39 because of the strong bullish sentiment. A further increase in BCH/USD value is expected in the next few hours.
Dogecoin price analysis conclusion
Dogecoin price analysis supports the bulls, as the price underwent a considerable recovery. The bullish momentum is intensifying, which is why the coin’s value now rests at a $0.08951 lower high. A further increase in the market value of the coin can be expected in the next few hours. On the other hand, selling pressure can also arise as the 4-hour chart hints at the presence of resistance at the $0.09289 level, which may halt the upwards price action for some time.
Source: https://www.cryptopolitan.com/dogecoin-price-analysis-2023-01-23/
