Cardano price analysis shows a continued bullish trend witnessed over the last 24 hours. ADA prices are up by 3.55 percent, this has seen Cardano prices rally above the $0.2482 level and set a new 24-hour high of $0.2623. The bulls have been in control over the last two days now as Cardano prices surged past several key levels. The bullish run was momentarily interrupted yesterday as prices fell to $0.2482, however, the buyers quickly stepped in to push prices back up.
Cardano price analysis reveals that the price is currently trading at $0.2572, and the bulls are looking to push prices higher. The next level of resistance is at $0.2623, and a break above this level could see Cardano prices test the $0.2650 resistance level. Support for ADA/USD has been established at the $0.2482 level, and a move below this level could see Cardano prices retest the $0.2482 support level.
The market capitalization for Cardano has now surpassed the $8.89 billion mark, and the project looks poised for further growth in the near future as well as the trading volume has increased to over $208 million in the last 24 hours.
Cardano price action in the last 24 hours: Strong market valuation tips bullish momentum for ADA
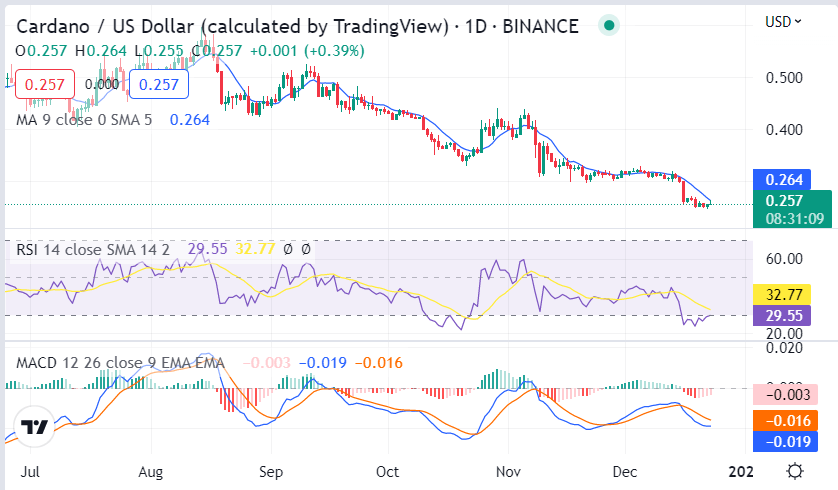
Cardano price analysis on a 1-day price chart indicates the strong bullish momentum that ADA has seen over the last 24 hours. ADA/USD pair is experiencing strong buying pressure that has escalated the prices past the $0.2482 level. The Cardano market is currently consolidating at $0.2572 as the bulls seek to push prices higher. The ADA is expected to experience some selling pressure at the current levels; however, the overall market sentiment remains bullish in the near term.

On technical analysis, in the 1-day price chart, the upward trend is expected to continue as the Stochastic indicator has moved into the overbought region. The Relative Strength Index (RSI) is also indicating strong bullish momentum with a value of 32.77. The MACD line is also above the signal line, which indicates a buy signal. The moving average indicator is also indicating a strong bullish trend with the 50-day moving average line holding above the 200-day moving average line.
Cardano price analysis on a 4-hour price chart: ADA/USD pair bouncing off $0.2482 support
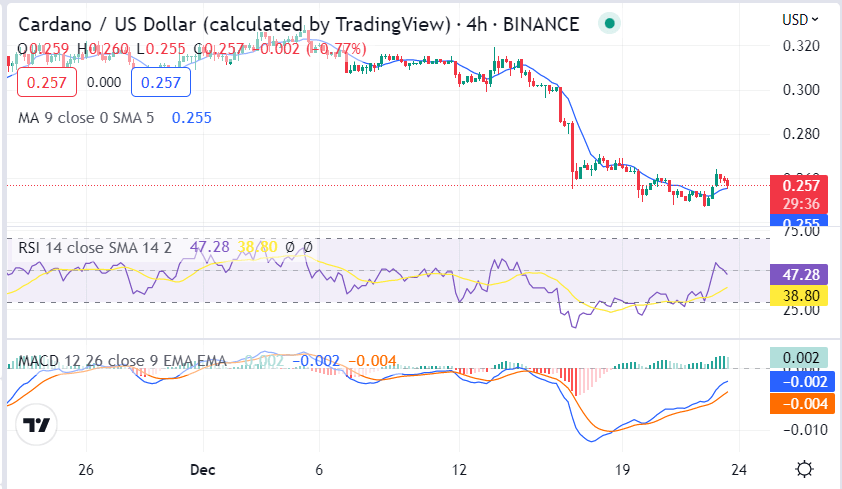
The 4-hour price chart for Cardano price analysis indicates that the market is in a bullish trend. The Green candlestick indicates a strong buying pressure that has pushed the prices past the $0.2623 resistance level. The moving average is currently at $0.255, and the bulls are looking to push prices higher.

The 4-hour Relative Strength Index (RSI) is also indicating a bullish trend with an RSI value of 38.80. The Stochastic indicator has moved into the overbought region, which is an indication of a buy signal. The MACD line is also above the signal line, which indicates a strong bullish trend in the near term.
Cardano price analysis conclusion
In conclusion, Cardano’s price analysis is expected to see further upside in the near term as strong buying pressure continues to push prices higher. The technical indicators are also indicating a bullish sentiment and the market could see further upside if buying pressure remains strong.
Source: https://www.cryptopolitan.com/cardano-price-analysis-2022-12-23/
