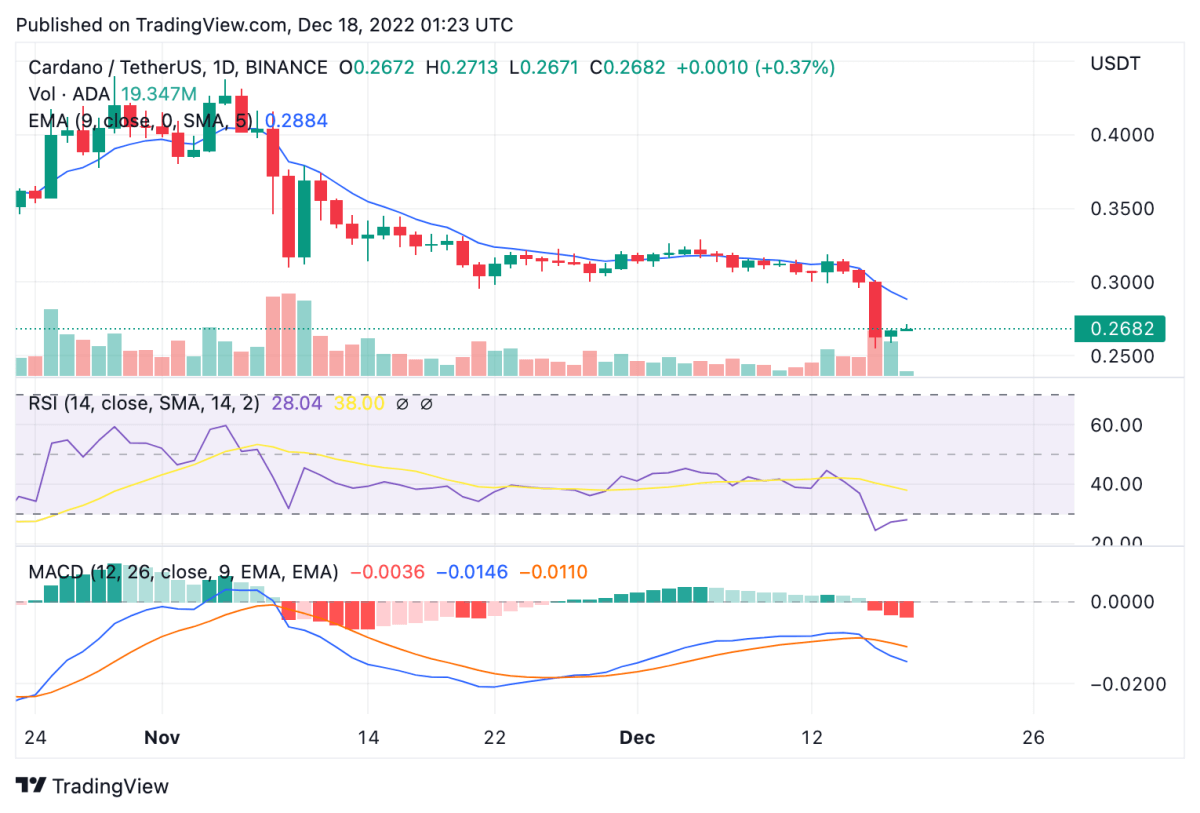
Cardano price analysis presents a severely bearish reading today, after yesterday’s decline down to $0.25. ADA price receded almost 17 percent yesterday, lowering from earlier support zone at $0.30. Since then, price has settled around $0.26 with a minor increment, but the overall market remains weak. Previously, Cardano bulls attempted to breach the resistance at $0.33, facing yet another rejection around that point. Over the current trend, price is likely to settle around the current price at $0.26, with a further slight increment up to $0.27 possible over the next 24 hours.
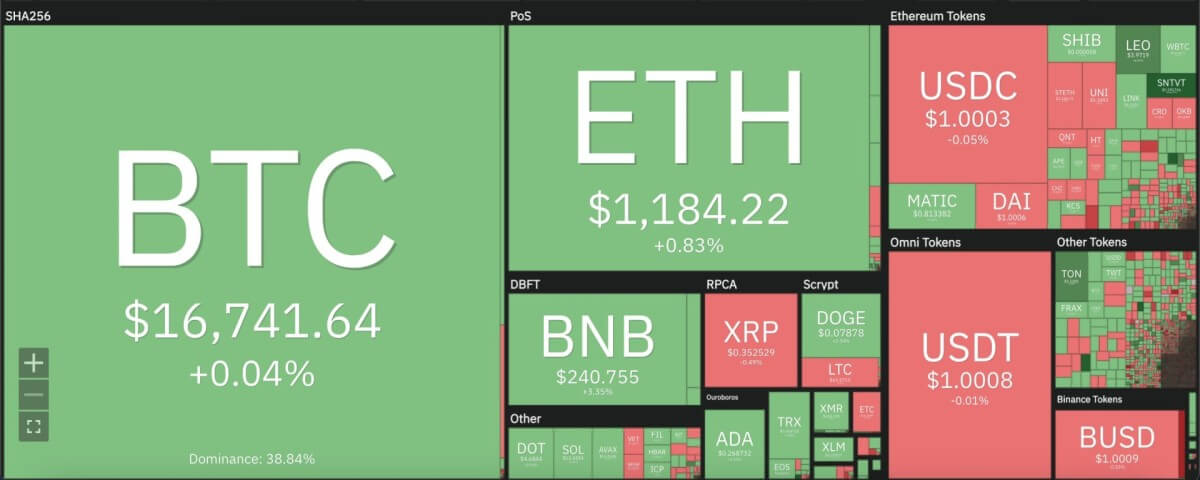
The larger cryptocurrency market remained bearish as well, as Bitcoin dropped down to $16,700 after yesterday’s drop below the $17,000 mark. Ethereum followed suit, but consolidated just below $1,200, whereas leading Altcoins also showed mixed trends. Ripple moved down to $0.25, while Dogecoin rose 2 percent at $0.07. Meanwhile, Solana and Polkadot rose 1 percent each to sit at $12.43 and $4.68, respectively.

Cardano price analysis: MACD curve crashed below signal line to sum up decline on daily chart
On the 24-hour candlestick chart for Cardano price analysis, price can be seen receding below the support zone at $0.30, after spending the best part of a month around the point in a horizontal trend. With yesterday’s decline, ADA price has moved below the 9 and 21-day moving averages, along with the crucial 50-day exponential moving average (EMA) at $0.28. Current 24-hour chart shows price just around the next support zone at $0.27. Pressure is expected to strengthen further if price falls below this support point.

The 24-hour relative strength index (RSI) moved deep into the oversold zone and is currently set at 28 after yesterday’s downtrend. Meanwhile, trading volume fell 24 percent over the last 24 hours, indicating lack of buyer interest following the bearish move. The moving average convergence divergence (MACD) curve crossed below the signal line to indicate a sell signal. Further sell orders may be initiated in advance of price falling to $0.26 and $0.20, with a further possibility to retest the $0.16 support.
Disclaimer. The information provided is not trading advice. Cryptopolitan.com holds no liability for any investments made based on the information provided on this page. We strongly recommend independent research and/or consultation with a qualified professional before making any investment decisions.
Source: https://www.cryptopolitan.com/cardano-price-analysis-2022-12-17/
