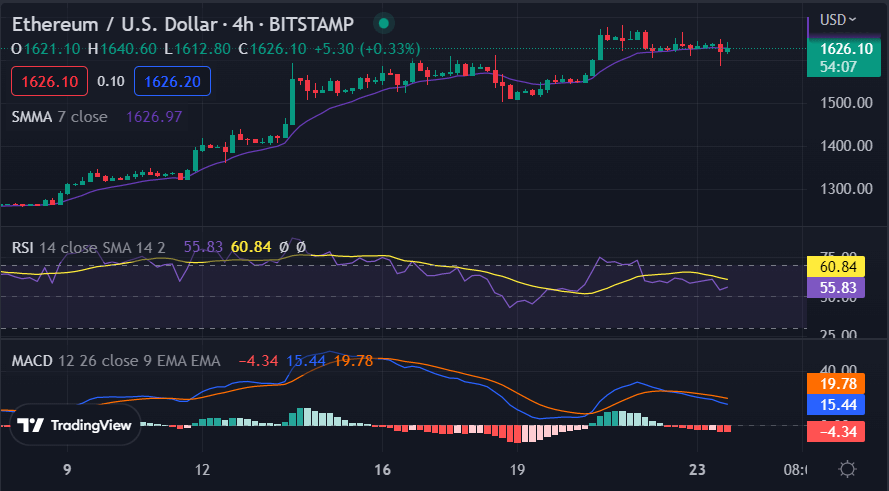
Ethereum price analysis is indicating that a drop in price has occurred today which has caused the price to lower to $1,632. The last week has seen a bullish strike as well which has been quite strong. Yet, the bears have once again overcome the bullish momentum and have been successful in maintaining their lead. The bullish pushed the price to a day’s high of $1,648 however the bears were quick to take control and since then the price has been steadily decreasing. The price levels are dropping once again and there is a great chance of ETH going through further loss in the following week.
The selling pressure has been quite strong over the past few days and this continues to be a major factor in Ethereum‘s price. As of now, the nearest support level is still very strong at $1,607 which could prove to be an effective buffer against any further drops in ETH prices. If bears continue to dominate then there is no telling how low Ethereum can go.
The 24-trading volume of Ethereum is also on a decline and this could be due to traders taking profits. However, the overall sentiment still seems to be bullish so there is some hope that another bull run may take place in the near future. The market cap of Ethereum is currently at $200 billion and it looks like it could go even higher if the bears manage to keep the prices down for a prolonged period of time.
Ethereum price analysis 1-day price chart: Bears debase coin value ruining further chances of improvement
The 1-day Ethereum price analysis is indicating that the price has undergone a major decline today. That has been made possible by the bears who have been able to interrupt the successive bullish wins. The bears have taken the price value down to $1,632, which has been surprising as the past week has seen a continuous rise in price.

The 50-SMA and 200-SMA indicate a bearish divergence and currently, both are well below the current price which indicates that the bears might still maintain their lead. The RSI is also in the bearish zone and it has been unable to make an exit from this region for some time now. This could be because of the selling pressure that is being applied by traders who want to take profits. The MACD is also in the bearish zone and it is declining further which could be a sign that bears may have more control over Ethereum’s price.
Ethereum price analysis: ETH bulls receive a great shock as price movement reverses abruptly
The 4-hour Ethereum price analysis is going strongly bearish as the cryptocurrency has gone through a major loss in the last hours. The ETH/USD price has dropped to the $1,632 level, which has been an unexpected blow. The bulls need to take control soon or else the price could go even lower.

The 50-SMA and 200-SMA both appear to be acting as support levels for Ethereum’s current price, however, the RSI has already entered the oversold region which indicates that bears are in complete control. The MACD is also declining further which is an indication that Ethereum is likely to go through further losses in the near future the histogram is also in the red zone and it may remain in this position for some time.
Overall, the Ethereum price analysis is bearish with a downward bias. The bulls need to step up soon if they want to prevent any further losses as we approach the end of the week. Nevertheless, support levels are still very strong at $1,607
Bitcoin price analysis conclusion
To sum up, Ethereum has been undergoing a major drop in price today as the bears have managed to take control. The market is currently quite bearish and it appears that the bears are in complete command of Ethereum’s price. The support levels have been weak, however, if bulls manage to gain some ground then there is a chance that the prices could rise again.
Source: https://www.cryptopolitan.com/ethereum-price-analysis-2023-01-23/
