The Avalanche price analysis shows a bearish trend today as it predicts a further drop in price levels. As the price continued to fluctuate in a range-bound manner over the past week, the coin displayed zigzag price action. But as the price has risen to $16.47, bulls are now outpacing their rivals, and the trend line is gradually moving lower. However, bears have reclaimed the advantage, and the price has slightly dropped. However, there has also been a small amount of bullish activity today, but the trend is still bearish and there is still bearish pressure on the price function.
AVAX/USD 1-day price chart: AVAX bulls unable to fend off selling pressure
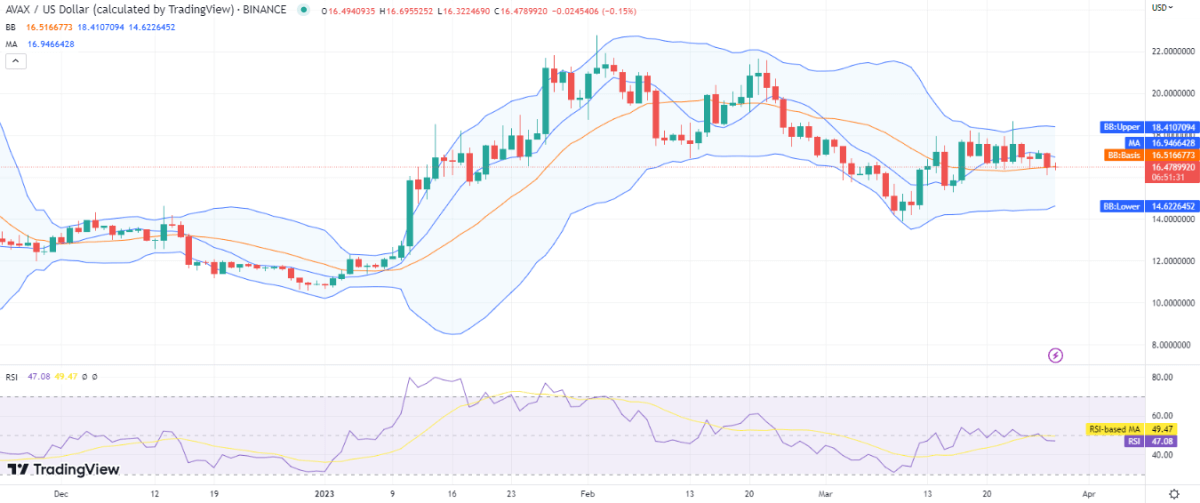
As the bears continue to dominate the market, the 1-day Avalanche price analysis indicates a decline in price today, with the price reaching the $16.47 level. The coin is still down 0.19 percent for the last 24 hours, but it has lost 4.98 percent of its value over the previous week because the trend was primarily bearish. Today’s trading volume has slightly decreased by 1.29 percent, and AVAX currently holds a 0.47 percent market share.

The Bollinger bands’ lower band reached the $14.62 level, indicating the strongest support for AVAX, and their upper band reached the $18.41 level, representing resistance due to the high volatility and the Bollinger bands’ expansion to cover a sizable portion of the charts. As a final indicator of selling activity in the market, the Relative Strength Index (RSI) also declined today, reaching index 47 on a slight downward curve. After moving downward, the moving average (MA) has also readjusted at the $16.94 level, just above the SMA 50 level.
Avalanche price analysis: Recent developments and further technical indications
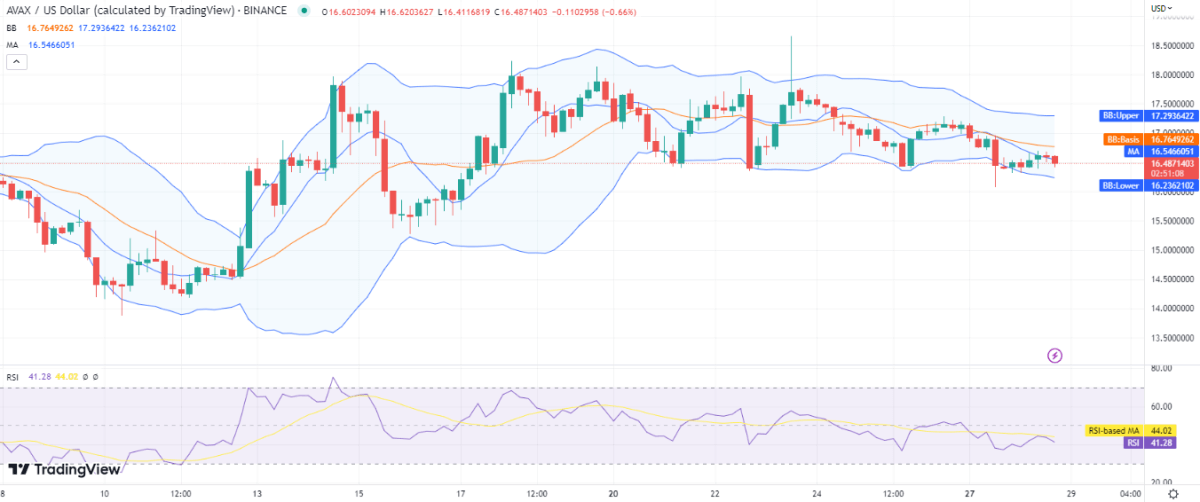
According to the 4-hour Avalanche price analysis, bulls and bears have been switching positions throughout the day as the trend has been fluctuating. This has confirmed the trend as being bullish for a significant portion of the day, but the bears have since returned and have seized the bullish price action by reintroducing selling pressure, resulting in a 0.71 percent loss in just the last hour as the price recently touched $16.48.

On the 4-hour price chart, the moving average is visible at $16.54, while the Bollinger bands average is visible at $16.76 above the MA. As the Bollinger bands begin to diverge, an increase in volatility has also been noticed. The volatility indicator’s upper and lower bands are both set at $17.29 and $16.23, respectively. While the upper band is keeping its level, the lower band is moving relatively more downward.
Avalanche price analysis: conclusion
The Avalanche price analysis suggests a bearish trend, but the momentum is not solid. The current correction observed on an hourly basis may extend, so we can expect the cryptocurrency to move in any direction from the current price point.
Source: https://www.cryptopolitan.com/avalanche-price-analysis-2023-03-28/
