Pi Coin continues to trade under pressure after a sustained selloff from the $0.66 range. The Pi coin price today is holding around $0.482, clinging to the last significant demand zone between $0.47 and $0.48. With recent candles hovering just above local support, all eyes are on whether this zone will attract enough buyers to hold off another leg down.
What’s Happening With Pi Coin’s Price?
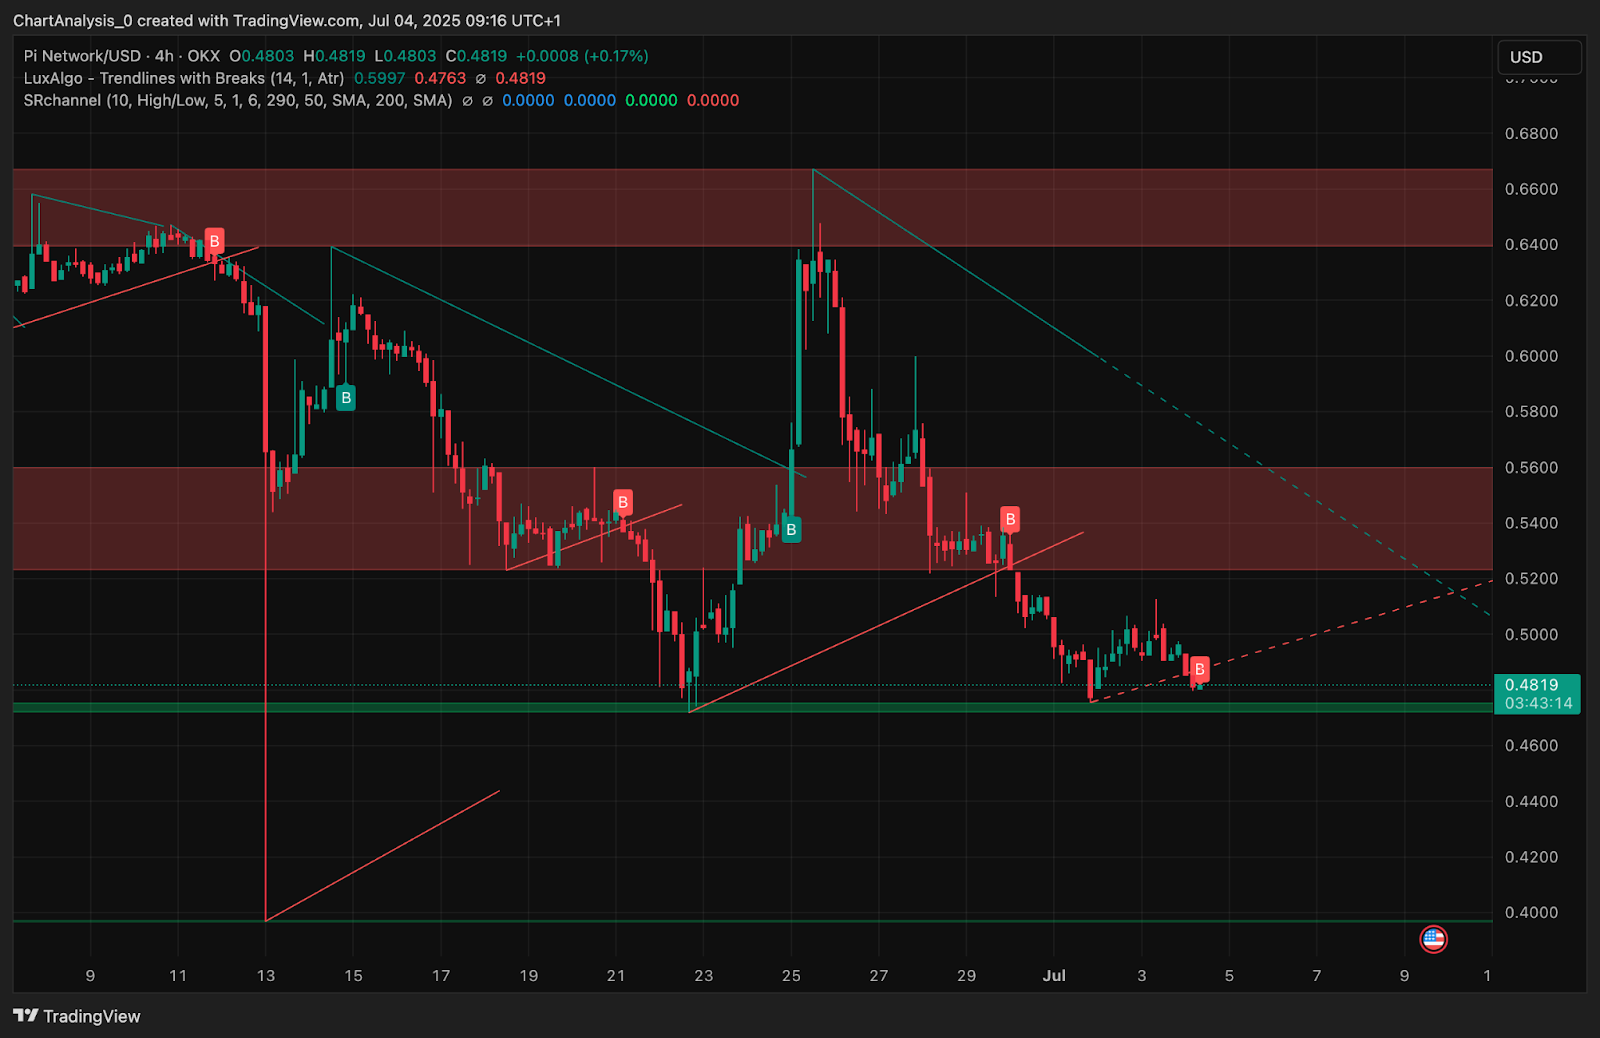

On the 4-hour chart, Pi coin price action remains trapped within a broader descending channel. Price recently bounced from the $0.4719 demand zone, which has historically acted as a pivot for temporary recoveries. However, repeated rejections from the $0.52–$0.5347 supply band, coupled with volume profile resistance, suggest the upside remains limited unless this area is decisively cleared.
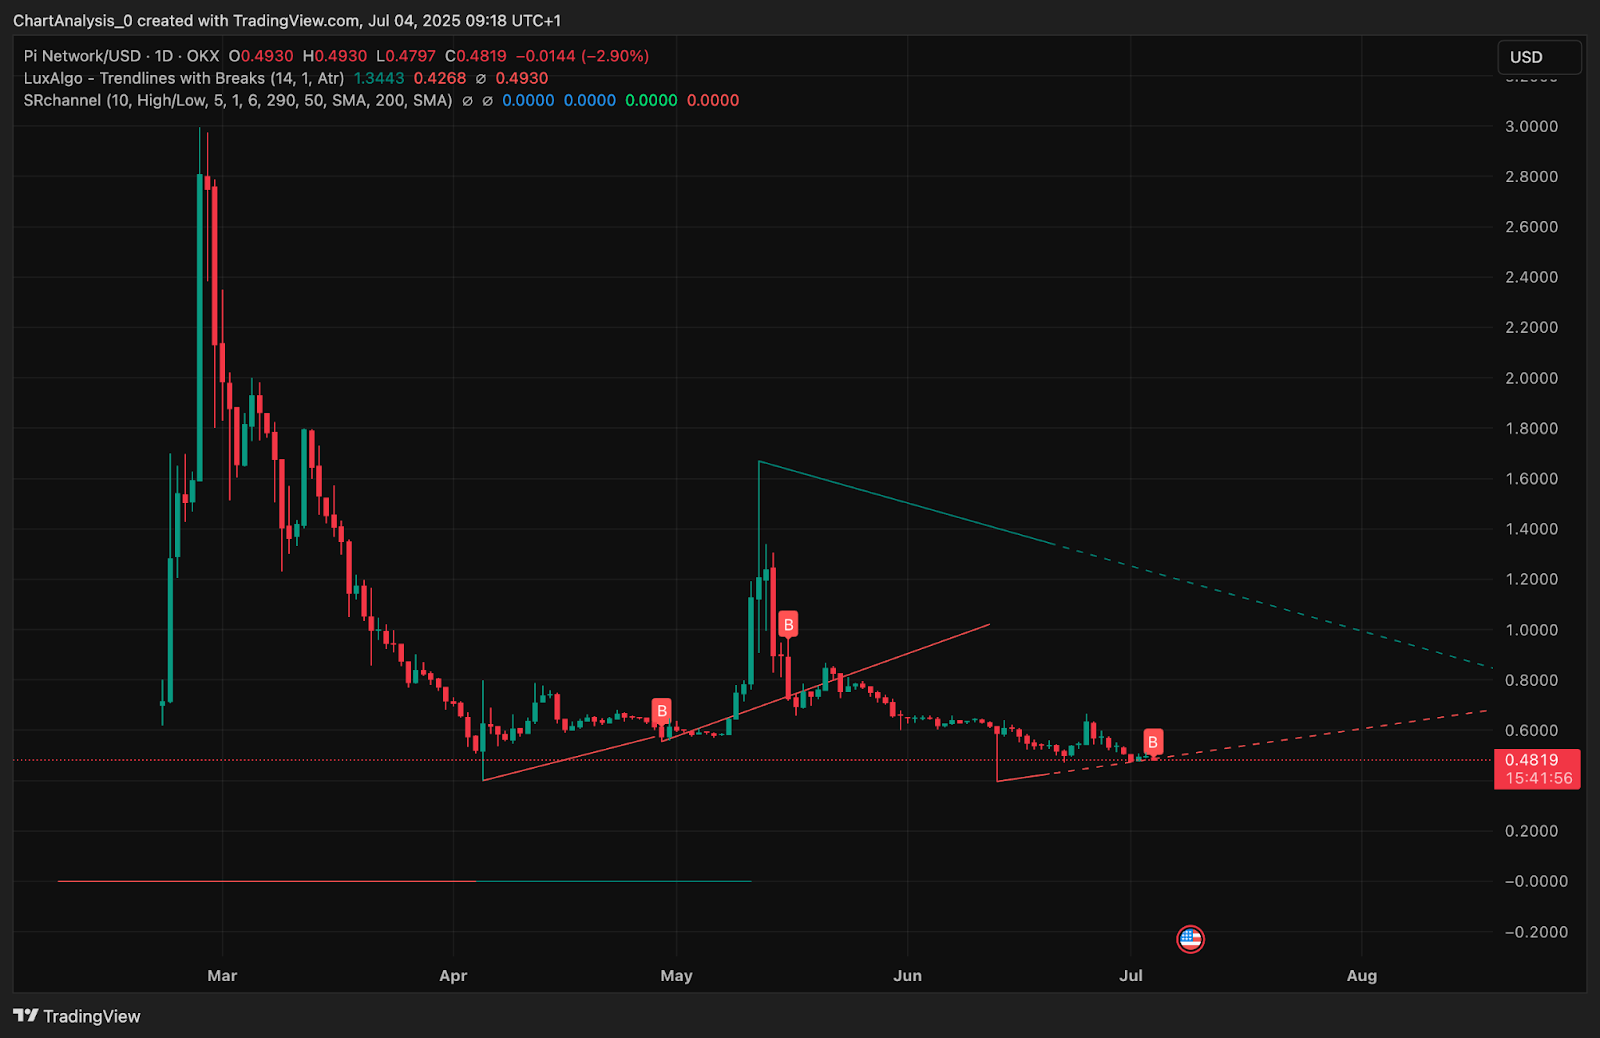
The daily structure shows a weakening trend, with lower highs since May and a failure to reclaim key dynamic resistance levels. Price continues to follow a bearish trajectory under the descending trendline, and any upside rally will need to break this diagonal pressure to confirm a reversal.
Why Is the Pi Coin Price Going Down Today?
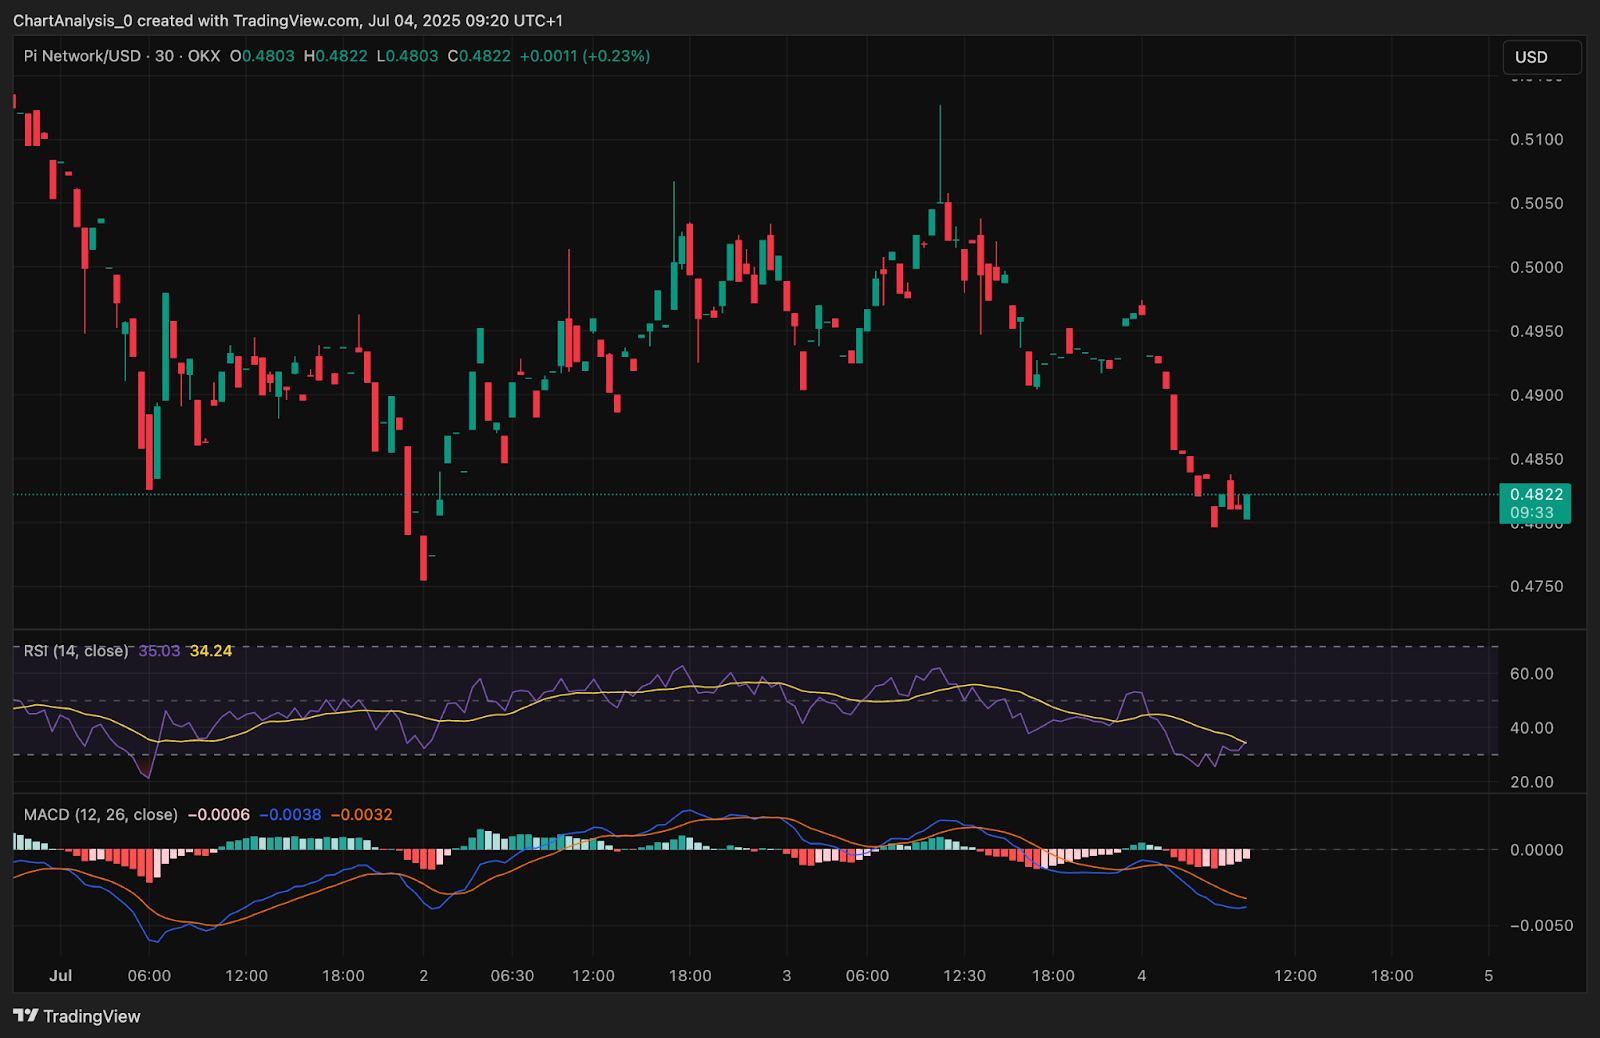
The reason why Pi coin price going down today stems from a combination of failed bullish attempts and weakening momentum. The 30-minute RSI is trading near 35, pointing to persistent bearish control with no short-term bullish divergence in sight. Simultaneously, MACD on the same timeframe shows a flat histogram with the signal line still below the zero mark — indicating muted recovery strength.
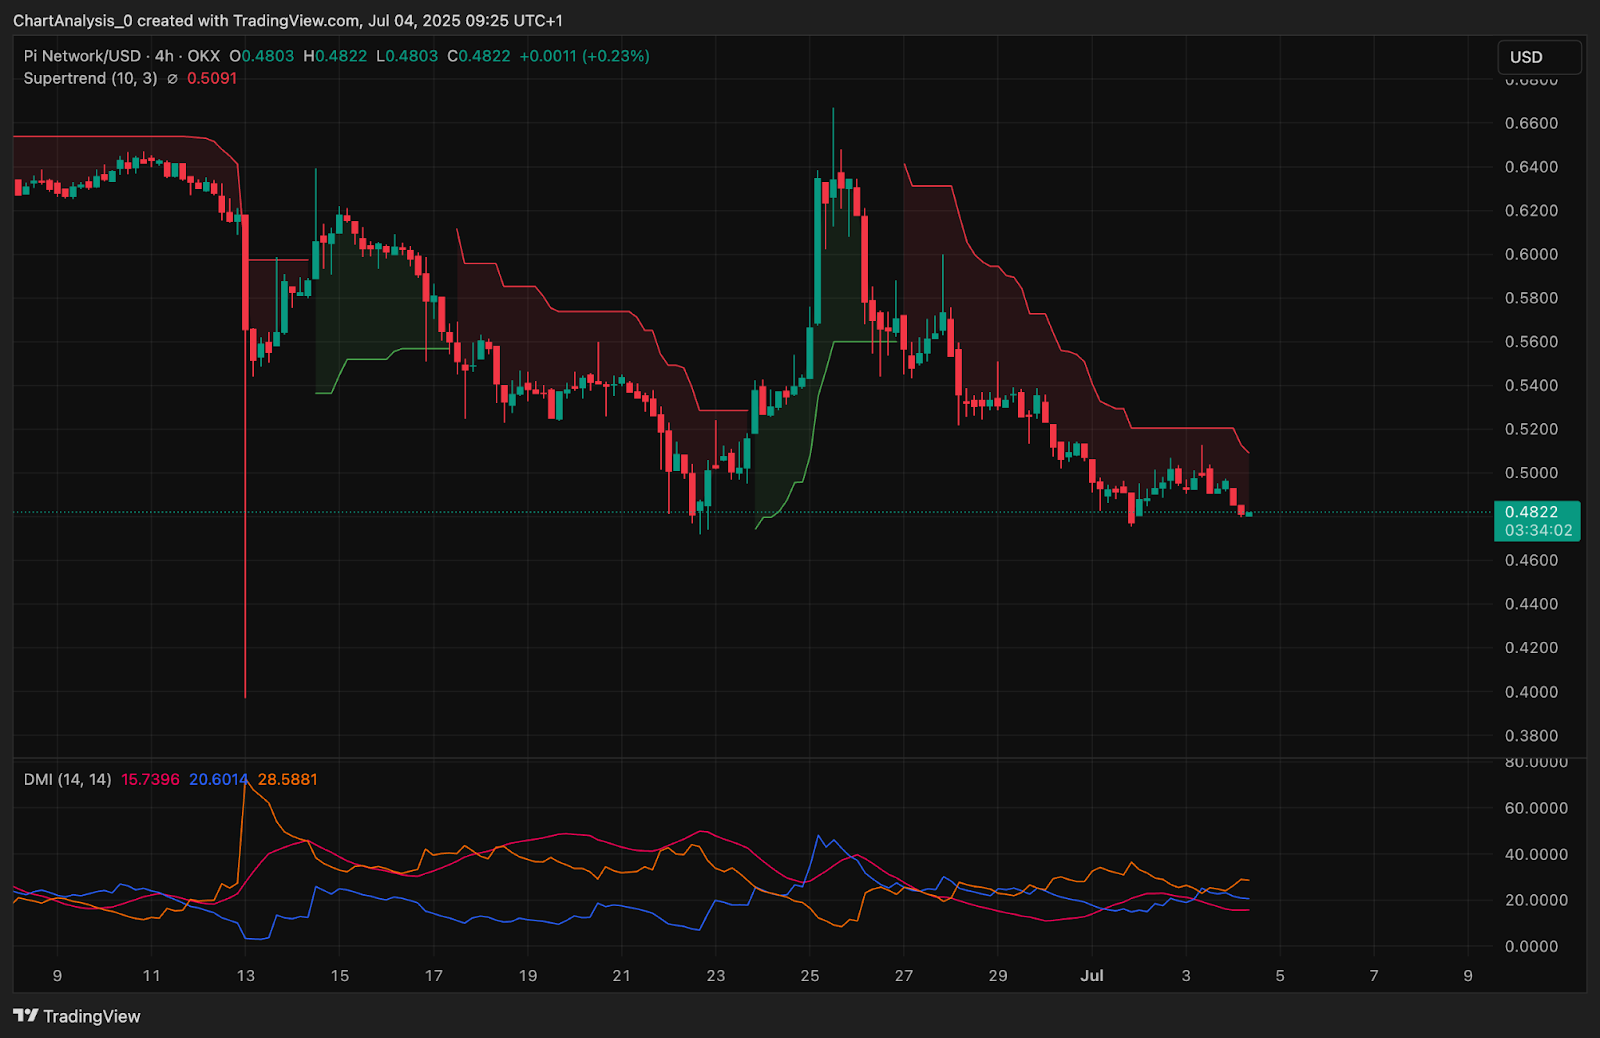
The Supertrend indicator on the 4-hour chart remains bearish at $0.5091, and the price continues to trade below this trend threshold. Directional Movement Index (DMI) adds further evidence of weakness, with the -DI (28.58) leading and ADX (20.6) rising — a pattern signaling growing bearish strength. Until the +DI reclaims dominance or ADX flattens, bearish trend continuation remains the base case.
Pi Price Prediction: Momentum Stalls As PI Holds Oversold Territory
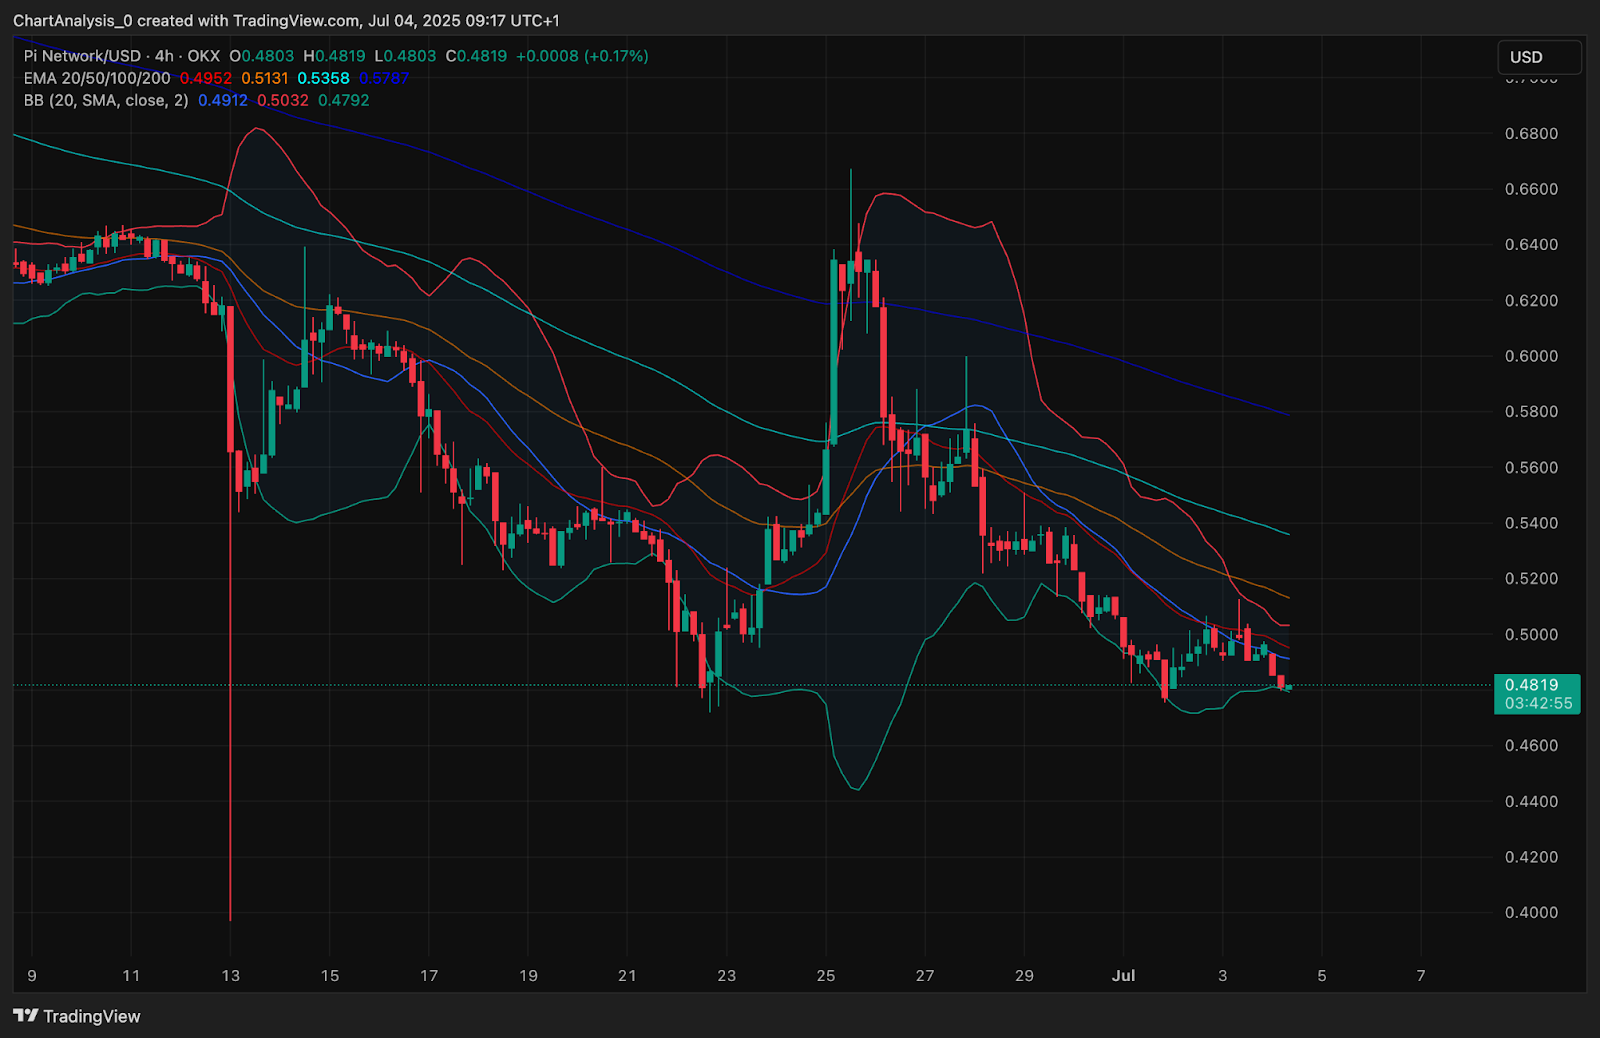
Furthermore, Pi is below all major exponential moving averages on the 4-hour chart, with the EMA 20/50/100/200 stack firmly bearish. The EMA20 ($0.4952) is now the first ceiling to overcome for any short-term bounce.
The Bollinger Bands on the 4-hour chart remain squeezed with price touching the lower band ($0.4792), a typical precursor to a volatility-driven move. However, the current candle structure shows no decisive reversal yet. This suggests a likelihood of another retest of $0.4719 or a breakdown attempt below this level.
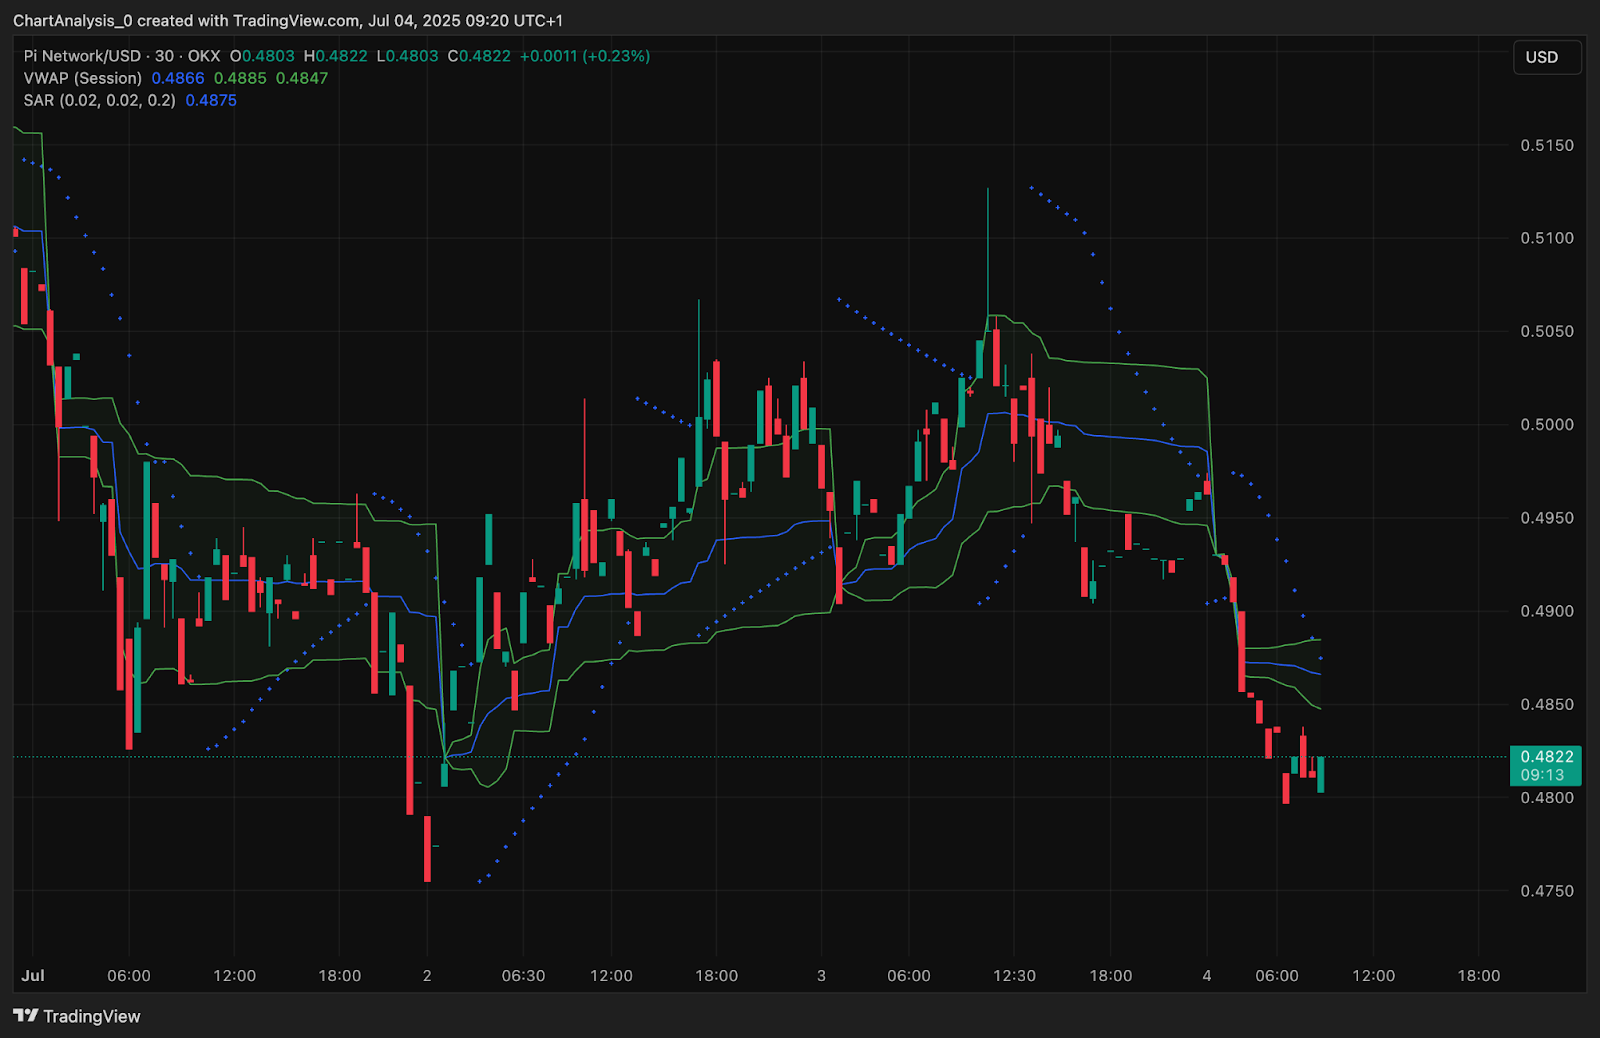
The VWAP on the 30-minute chart has also turned into resistance at $0.4885, with price consolidating underneath it. This alignment further confirms that bulls are struggling to reclaim intraday momentum.
Adding to the pressure, the Parabolic SAR dots have flipped back above price on the 30-minute chart, reinforcing a continuation of the downtrend unless short-term volatility spikes upward.
PI Price Prediction: Short-Term Outlook (24h)

In the next 24 hours, if Pi coin price breaks below the $0.4719 level, the next downside zone to monitor will be around $0.442–$0.450. This area aligns with historical inefficiency zones and the lower edge of volume profile support.
The volume profile reveals a strong demand zone between $0.4719 and $0.4800, where previous selloffs were absorbed and buying interest spiked. This region forms a critical defense area, and any breakdown below it could trigger a drop toward $0.44. On the upside, thin volume between $0.50 and $0.5347 indicates weak support for sustained rallies. Reclaiming $0.5347 is essential for bulls to challenge the broader bearish structure.
From a broader perspective, the daily chart structure stays bearish below $0.60, where trendline resistance and major liquidity clusters sit. Any meaningful macro shift would require a break above that region, which remains distant for now.
Pi Coin Price Forecast Table: July 5, 2025
| Indicator/Zone | Level (USD) | Signal |
| Pi coin price today | 0.482 | Holding key demand zone |
| Immediate Support | 0.4719 | Breakdown trigger |
| Deeper Support Zone | 0.442 – 0.450 | Next key demand |
| Resistance 1 | 0.495 – 0.500 | EMA20 and VWAP confluence |
| Resistance 2 | 0.5347 | Prior SMC-based rejection zone |
| RSI (30-min) | 35 | Oversold, weak momentum |
| MACD Histogram | Flat | No clear momentum shift |
| Bollinger Bands (4H) | Lower touch | Volatility build-up |
| Supertrend (4H) | 0.5091 | Bearish |
| DMI/ADX | -DI leading | Bearish trend strengthening |
Disclaimer: The information presented in this article is for informational and educational purposes only. The article does not constitute financial advice or advice of any kind. Coin Edition is not responsible for any losses incurred as a result of the utilization of content, products, or services mentioned. Readers are advised to exercise caution before taking any action related to the company.
Source: https://coinedition.com/pi-coin-pi-price-prediction-for-july-5-2025/