
Dogecoin has spent the past few weeks oscillating in a tight range, with prices hesitating around the $0.17 level and facing consistent pressure near the $0.185 resistance zone. Despite several attempts to push higher, the meme coin has lacked sustained momentum until the past 24 hours after Bitcoin’s break above $100,000 again. A recent post by crypto analyst Trader Tardigrade points to the bullish sentiment, suggesting that Dogecoin’s next leg up is programmed and perfectly on schedule.
Dogecoin’s Rally Is Programmed Due To Repeating 29-Day Cycle
According to Trader Tardigrade, Dogecoin’s price action is showing an interesting regular rhythm. Noting a chart that tracks the Relative Strength Index (RSI) against Dogecoin’s daily candlestick price chart, the analyst pointed out that every 29 days, Dogecoin completes a cycle that ends with a breakout.
The exact sequence has now occurred three times: each time followed by a sharp rally. The image accompanying his post illustrates three distinct RSI breakout points spaced exactly 29 days apart, with each initiating a powerful upward move in Dogecoin’s price.
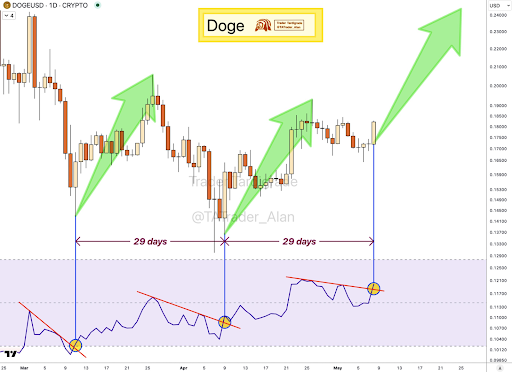
This repeating cycle appears to be driven by RSI downtrend breakouts. The first breakout occurred in early March, while the second breakout occurred in early April. In each of the two previous occurrences, Dogecoin’s RSI formed a descending trendline that was broken just as the cycle reset, which sent price action upward. Now, with the most recent RSI downtrend line also broken and the 29-day interval completed once again, the conditions for another programmed move are, in Tardigrade’s words, “on time.”
Programmed Uptrend To Send DOGE Above $0.23 Again
The technical basis behind Trader Tardigrade’s prediction is in the RSI behavior. The RSI is a momentum indicator often used to detect potential reversals or continuations in price action. In Dogecoin’s case, the RSI has consistently reset downwards since it broke below oversold levels on March 9. However, the past two cases have led to a slow build-up, eventually breaking above a local resistance line. Notably, the RSI breakout is occurring at the exact same interval as the one seen in the previous two rallies.
The green arrows on the chart, placed directly after each RSI breakout, show clear and steep price increases, showing these moments mark the beginning of bullish phases. If the pattern holds, Dogecoin may enter another strong upward phase that could take it beyond the $0.20 level. Particularly, a measured move based on the two previous playouts put the price target toward the next psychological resistance zone around $0.24. This price target resonates with a different technical outlook, which is based on a head and shoulder formation showing up on the daily timeframe.
At the time of writing, Dogecoin is trading at $0.1971, up 9% and 8.9% in the past 24 hours and seven days, respectively. This latest uptrend is caused by Bitcoin’s recent break above the psychological $100,000 price level.
Featured image from Getty Images, chart from Tradingview.com
Editorial Process for bitcoinist is centered on delivering thoroughly researched, accurate, and unbiased content. We uphold strict sourcing standards, and each page undergoes diligent review by our team of top technology experts and seasoned editors. This process ensures the integrity, relevance, and value of our content for our readers.
Source: https://bitcoinist.com/dogecoin-breakout-is-programmed/