The XRP and BTC prices remained under pressure on Monday as demand waned, liquidations jumped, and the Crypto Fear and Greed moved to the extreme fear zone of 18. This article explores what expect if Michael Saylor dumps Bitcoin as the crypto market crash continues and Strategy’s Bitcoin holdings get underwater.
Michael Saylor’s Strategy Bitcoin Holdings are Underwater
XRP and BTC prices continued falling on Monday as the crypto market crash accelerated, as geopolitical tensions rose, and after Donald Trump nominated Kevin Warsh to become the next Federal Reserve Chair. Warsh has a history of being a hawk, meaning that the bank will likely not cut interest as fast as Donald Trump wants.
The ongoing crypto crash has hit Michael Saylor, whose Bitcoin holdings have moved underwater. Data compiled by Bitcoin Treasuries shows that the company’s average cost basis is $76,040, slightly below the current Bitcoin price level of $76,300.
Therefore, the ongoing Bitcoin price performance and the plunging net asset value (NAV) has raised concerns that Strategy may decide to sell some of its Bitcoins and use the proceeds to pay dividends to its preferred shares and pay its debt.
These fears rose last year when its CEO hinted that it would sell its coins if the mMAV turned negative. However, chances are that the fears of Strategy selling its coins are overstated.
Saylor has ruled out selling the coins this year, and chances are that he will buy more in the near term. That’s because the company has billions of dollars in shares available to sell to buy more coins.
Also, the company has raised over $2 billion in cash in the past few months. These funds will be enough for the company to pay its dividends and pay its outstanding debt.
BTC Price Prediction: Technical Analysis
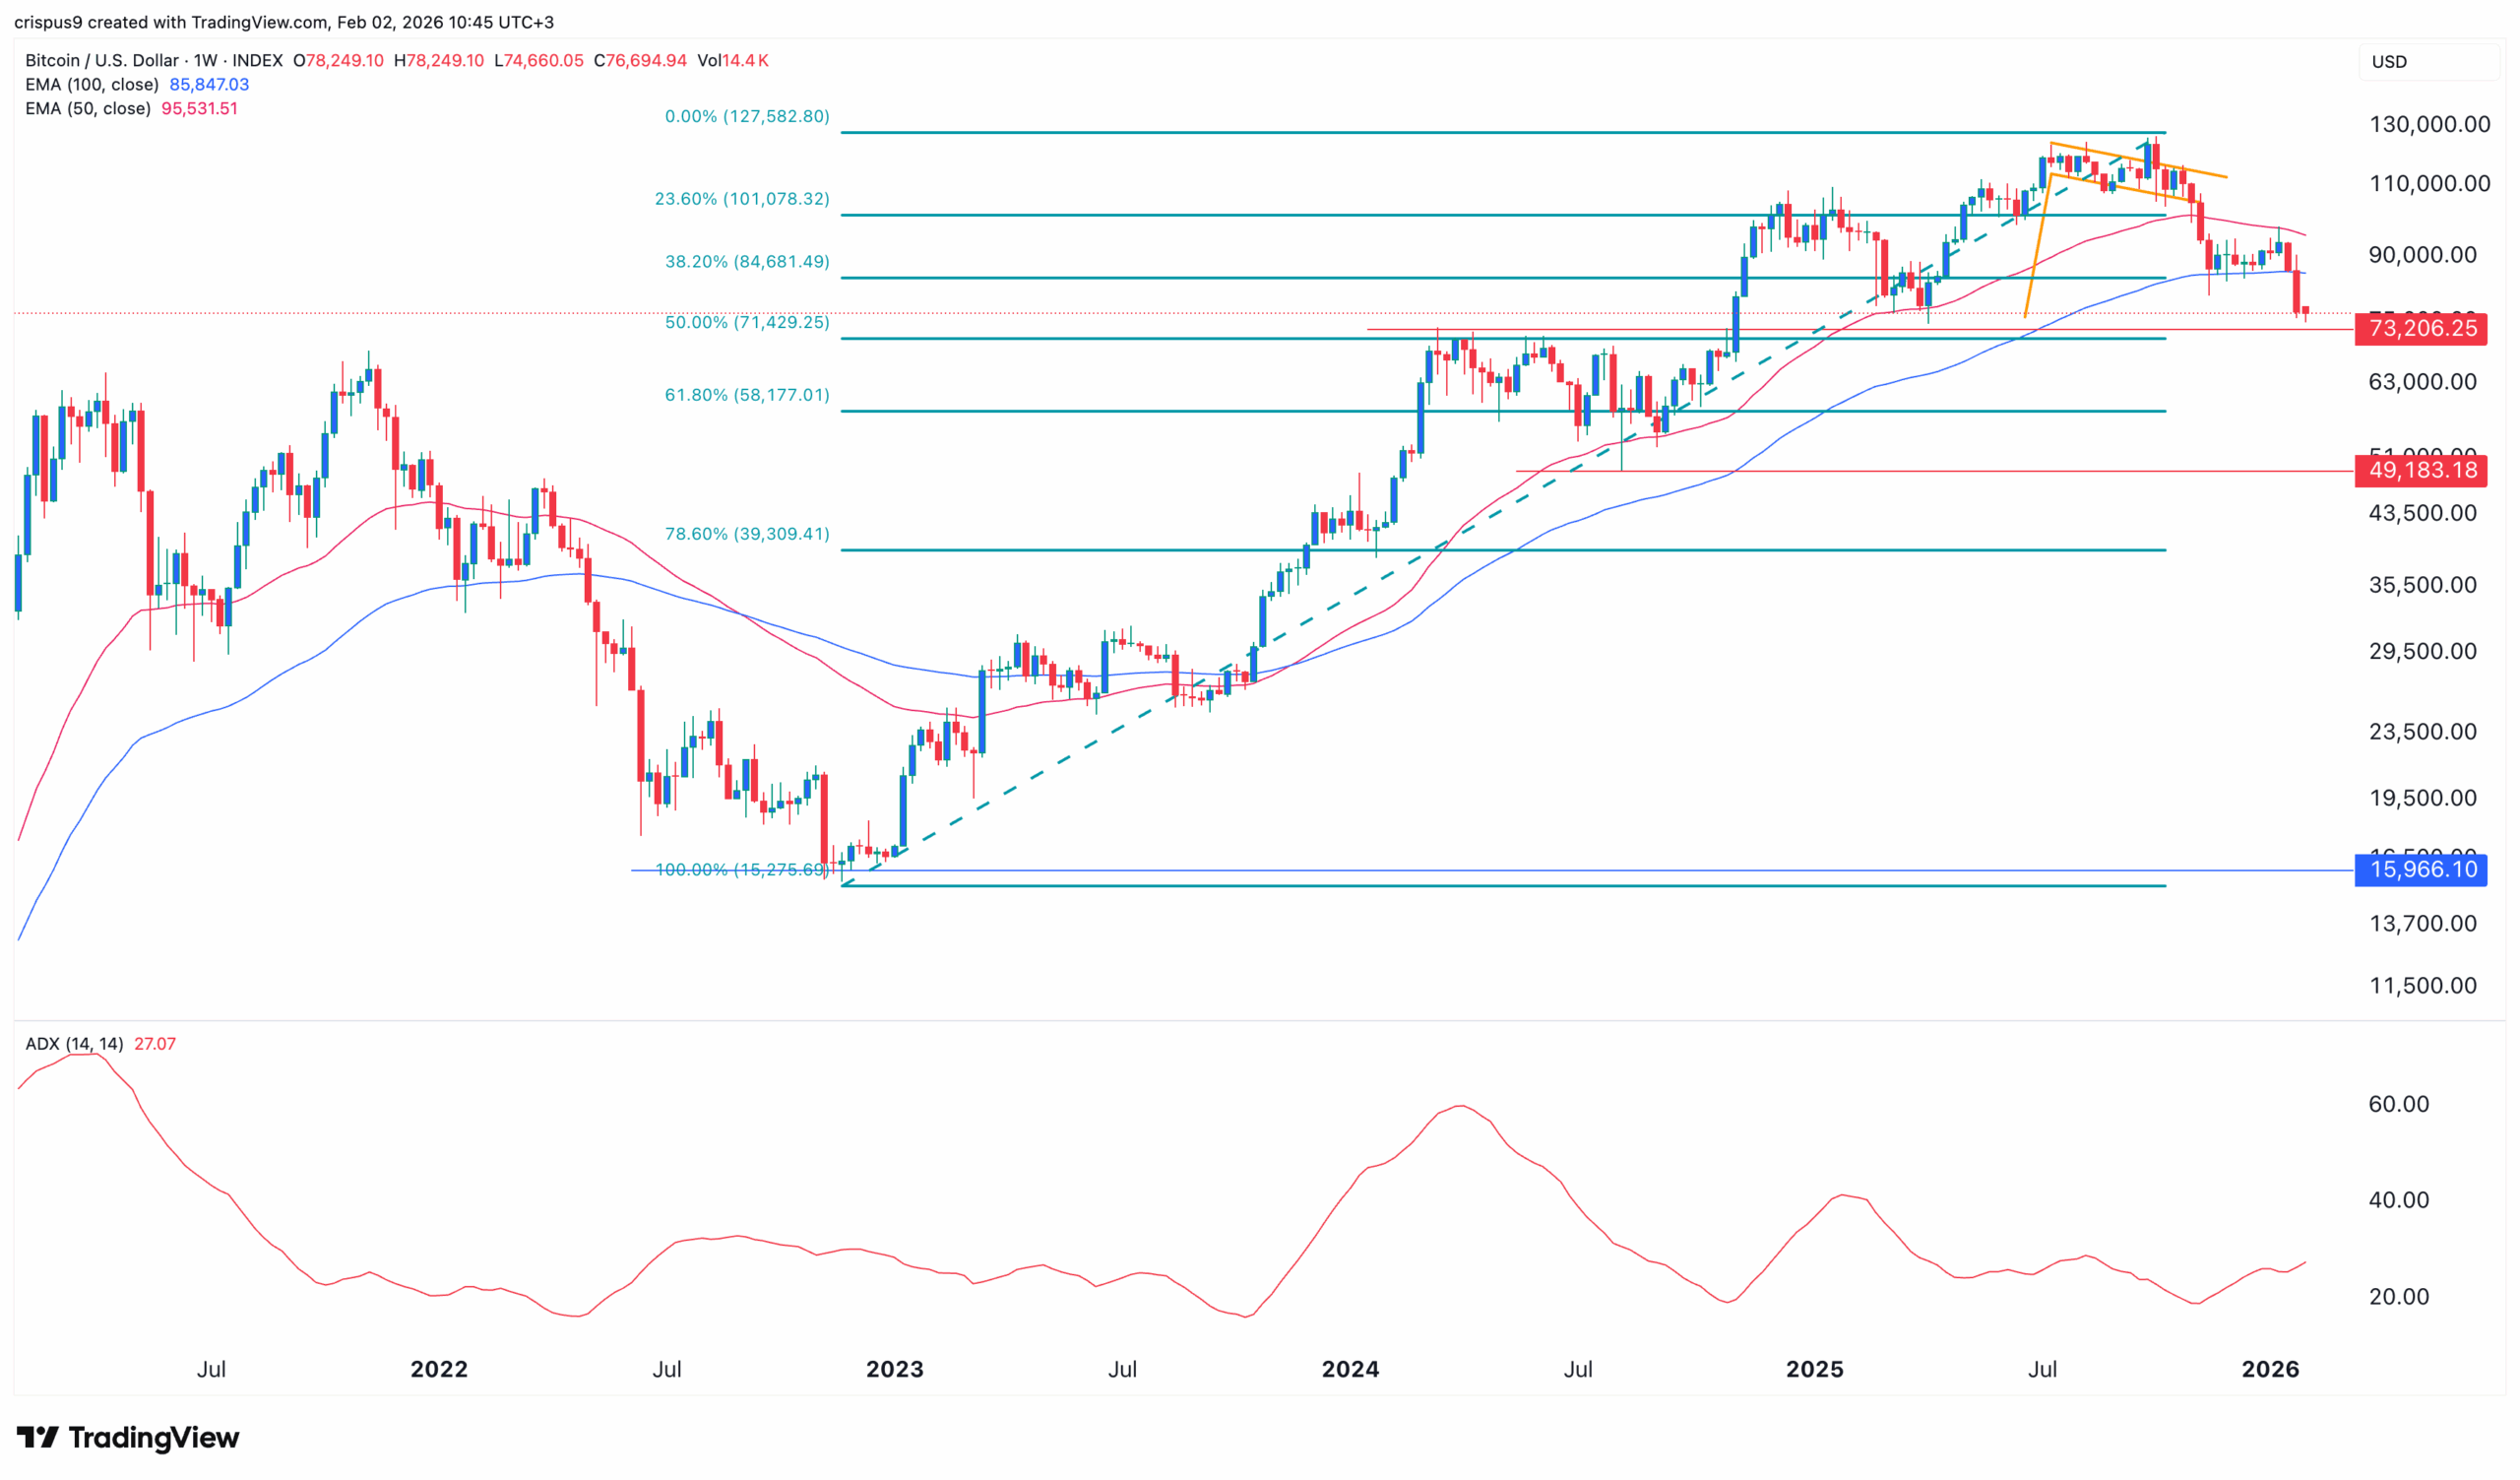
The weekly timeframe chart shows that the BTC price has crashed in the past few months. This crash happened after the coin formed a giant rising wedge chart pattern, a highly common bearish reversal sign in technical analysis.
The coin has moved below the lower side of the bearish flag pattern. It has also dropped below the 38.2% Fibonacci Retracement level at $84,680 and the Supertrend indicator.
The Average Directional Index (ADX) has continued rising and is now at 27 and pointing upwards, a sign that the downtrend is gaining momentum.
Therefore, the most likely BTC price forecast is bearish, with the next key support level being at the 61.8% Fibonacci Retracement level at $58,177. A move above the 38.2% Fibonacci Retracement level at $85,000 will invalidate the bearish outlook.

XRP Price Prediction: Technical Analysis
The weekly chart shows that the XRP price has formed several bearish signs that may lead to more downside in the coming weeks.
It formed a giant double-top pattern at $3.3890 and a neckline at $1.5890. This neckline coincides with the 61.8% Fibonacci Retracement level.
The coin has also moved below the a 50-week and 100-week Exponential Moving Averages (EMA) and the Supertrend indicator. The ADX indicator has continued rising, while the Relative Strength Index (RSI) and the MACD have continued falling.
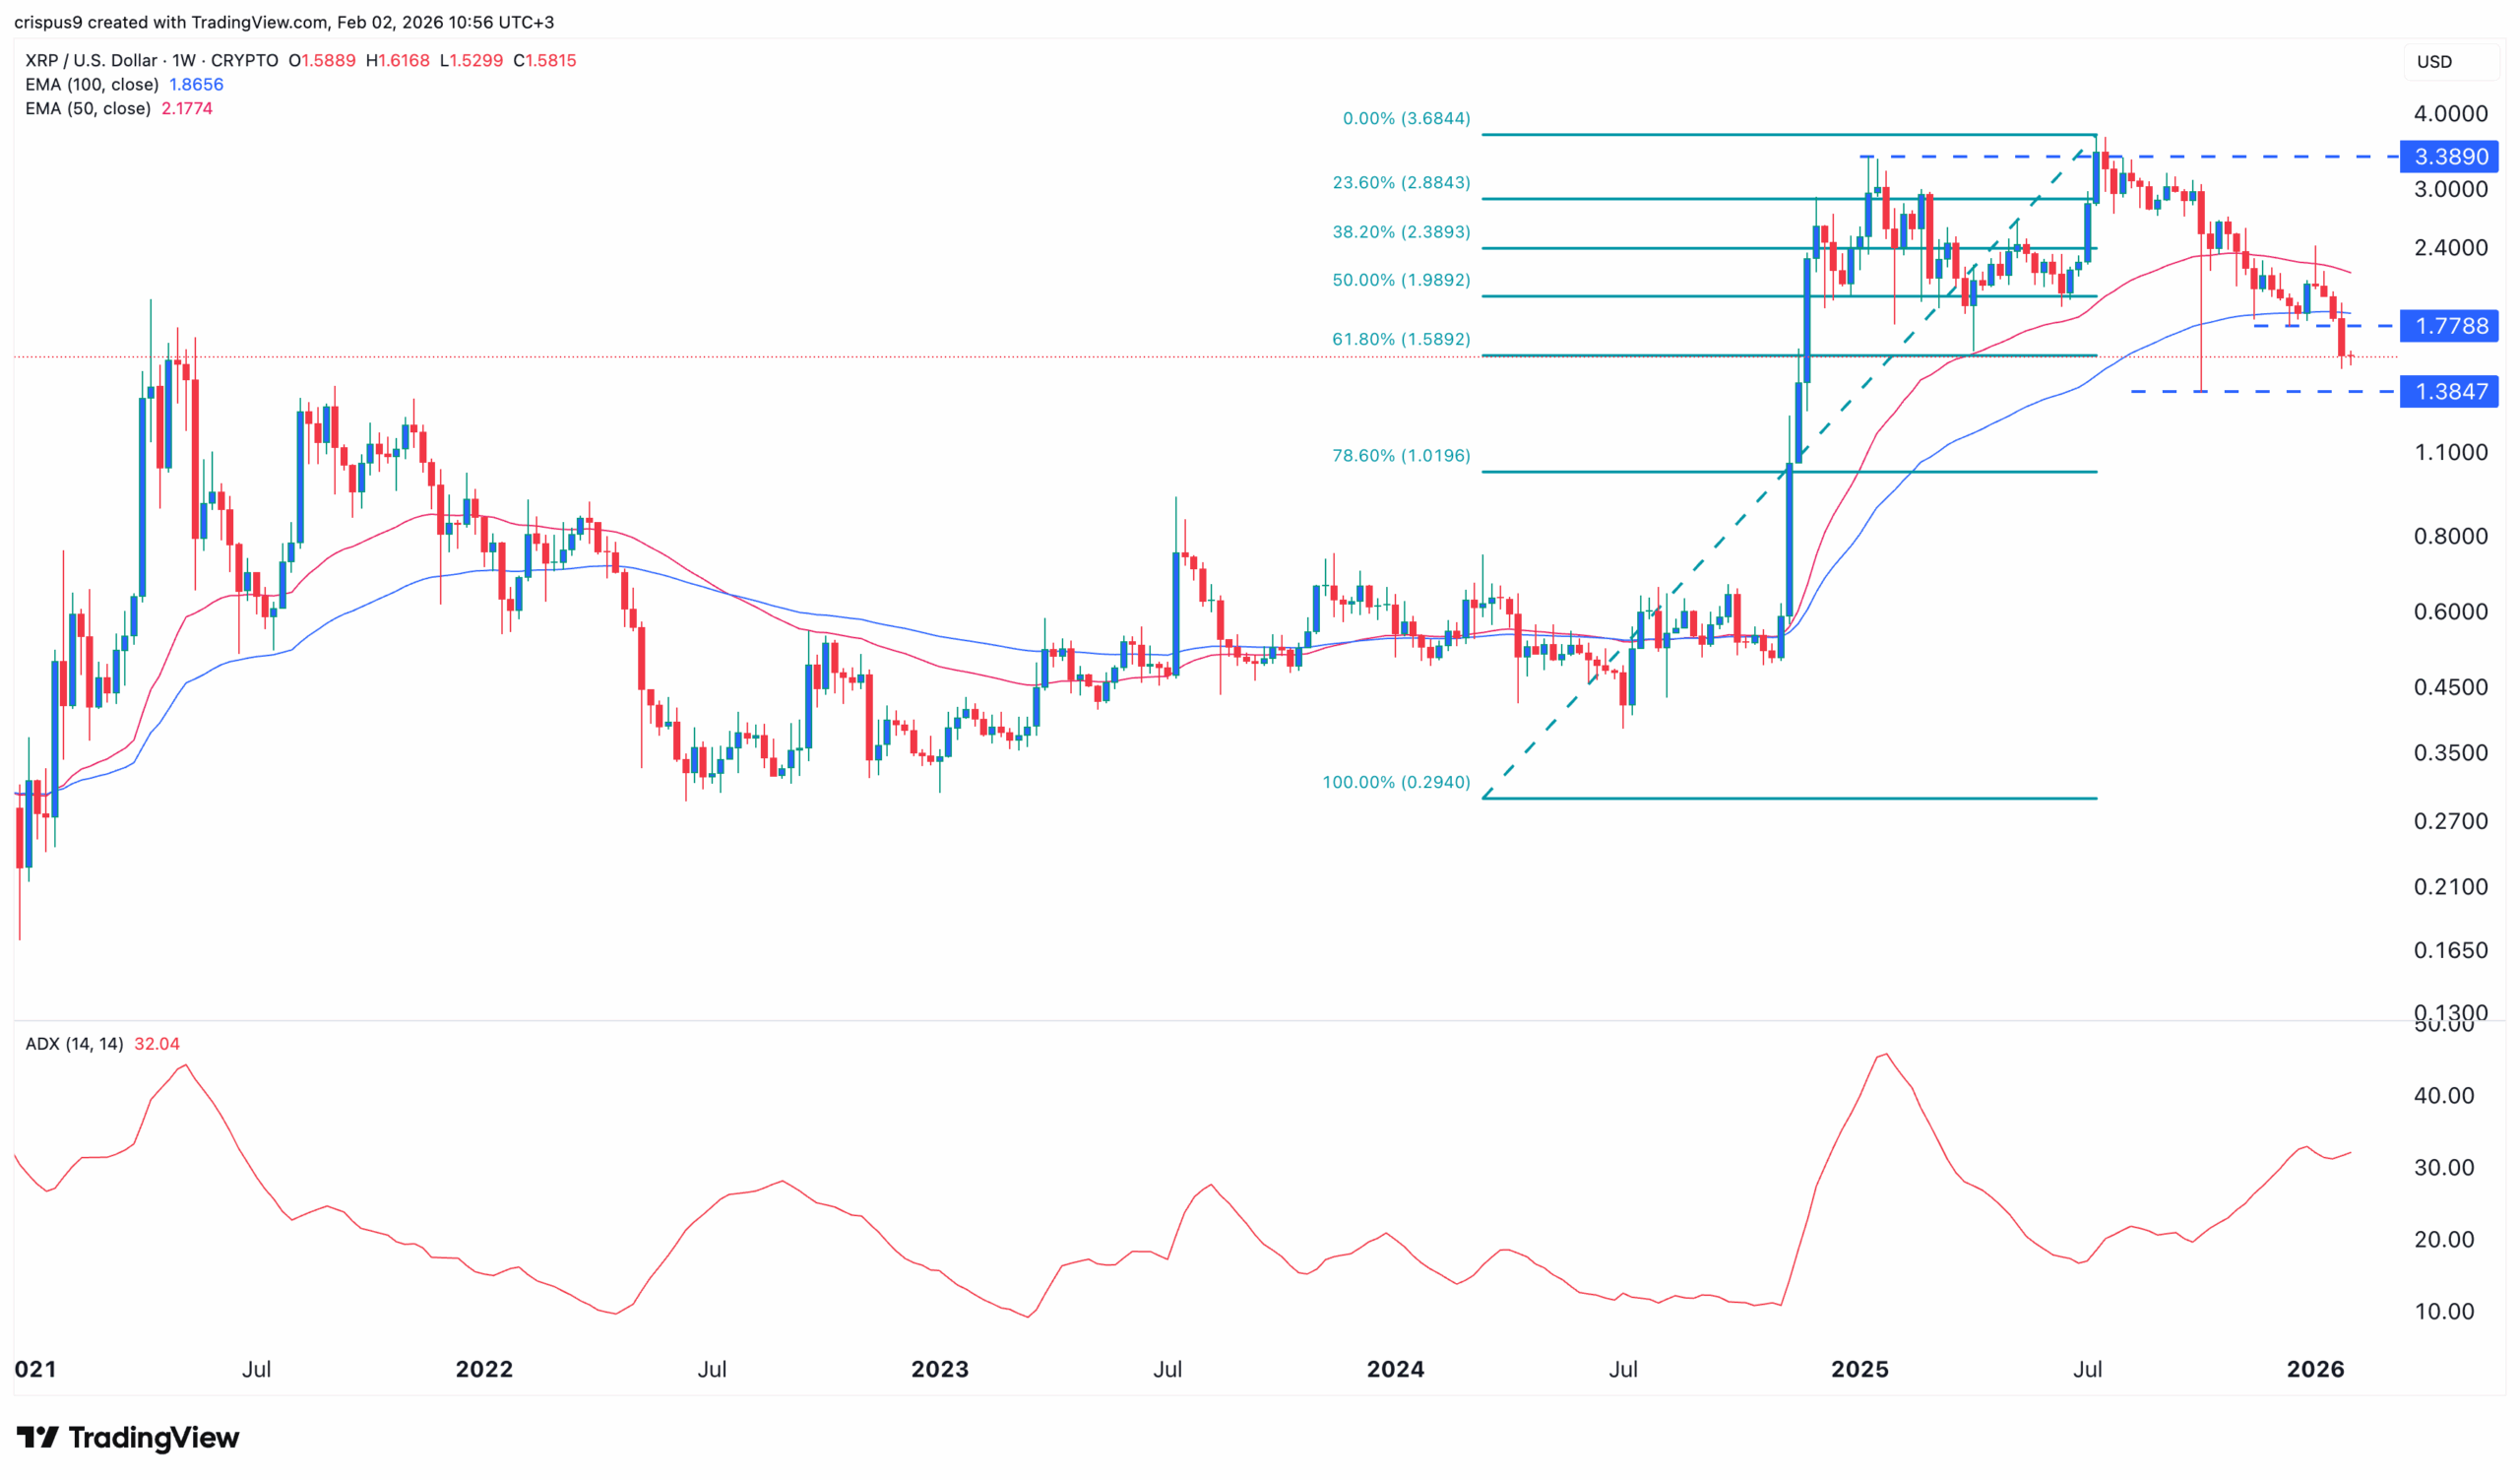

Therefore, the most likely scenario is where it continues falling, potentially to the key support level at $1.