Key Takeaways
Why did Bitcoin and the crypto market fall so quickly?
Low liquidity during the late-night hours in the U.S. meant reduced liquidity in the market, ripe conditions for a liquidity hunt.
Can the crypto market recover later this week?
It is possible, and would be dependent on the crypto market response during the U.S. New York trading session. The $112.9k and $116.1k would be the next levels to watch.
In the past 12 hours, Bitcoin [BTC] dived 3.31%, from $115.6k to $111.8k. Ethereum [ETH] fared much worse, falling 9.34% in the same period.
Coinalyze data showed that Bitcoin and Ethereum saw their 24-hour Open Interest slashed by 4.86% and 9.6% respectively.
According to CoinGlass, the past 24 hours have seen $1.7 billion in liquidations across the crypto market. The lion’s share were long positions, making up $1.62 billion of the liquidations.
The Kobeissi Letter noted that Sunday night sell-offs were frequent due to the low liquidity. These tend to be bought during the Monday morning U.S. market open.
To understand which way the crypto market will move next, it is critical to determine what Bitcoin is doing and where it could be headed next.
The market-wide sentiment is usually dictated by the king of crypto, while other tokens, such as the meme coin leader Dogecoin [DOGE], tend to lead their sectors.

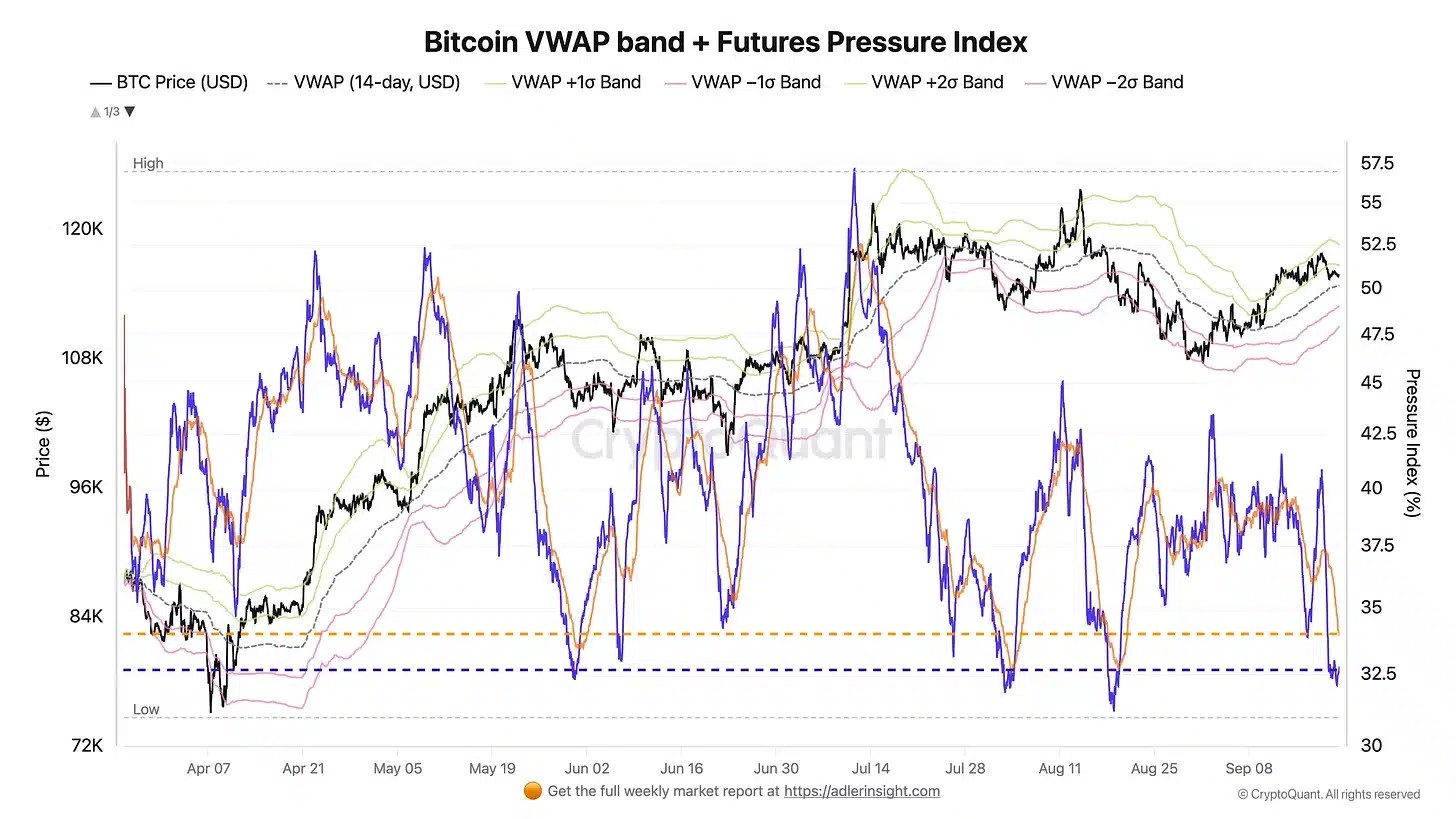
Source: Axel Adler Jr Insights
Crypto analyst Axel Adler Jr observed in the weekly newsletter that the $112.9k level was key, from a VWAP perspective.
The Futures pressure index has eased, according to the chart above, and aggressive longs and leverage were not dominant.
If the price can remain above $112.9k, it would be a moderately bullish signal. At the time of writing, Bitcoin has climbed back to $112.9k.
This meant that the move downward in recent hours was a liquidity hunt, magnified by a liquidation cascade.
Has the crypto market begun to stabilize?


Source: BTC/USDT on TradingView
This is a tricky question without a clear answer at the time of writing. Technical analysis outlined the firmly bearish structure of BTC on the 1-hour chart. The key swing points were marked in yellow.
The break below the $114.7k a few hours ago represented a bearish structural shift.
This move was made with a fair value gap, or imbalance, just above the previous swing low- a representation of the strength of the sellers.
This also meant that the $116.1k was the significant swing high on this timeframe to focus on, since it was the place where the downward move originated.


Source: Coinglass
To reiterate the point that the price moved in search of liquidity, the liquidation heatmap was examined. For BTC, it showed further pain was possible, as the $105.5k-$109k was a noteworthy magnetic zone.
Traders should note that Bitcoin does not have to drop to these liquidity pockets – just as it did not have to collect the liquidity around $120k before falling lower.


Source: CoinGlass
Since Ethereum tends to lead altcoin market moves, the chance of an ETH recovery was also examined. AMBCrypto found a dense zone of liquidation levels at $4.2k, which has already been taken out.
Ethereum appeared ready for a reversal. A reversal when the U.S. market opens is a possibility.
Source: https://ambcrypto.com/will-this-week-be-different-for-the-crypto-market-bitcoin-has-the-answer/