Bitcoin [BTC] has traded within a relatively narrow range between $68,936 and $71,751. As price consolidates within this band, the key question is whether the asset will break higher or resolve to the downside once it exits this range.
With derivatives activity accounting for the bulk of market engagement, positioning among futures traders has become a primary indicator of short-term price direction.
Derivatives volume shifts in favor of sellers
Bitcoin’s net derivatives trading volume has turned negative for the first time in several months, signaling a shift in market control.
Net Taker Volume data shows that from November through January, derivatives activity was buyer-led, with net volume remaining positive at approximately $36 million. This trend has reversed in the current month.
At the time of writing, net volume stood at $270 million in favor of sellers, according to CryptoQuant data. This reflects increased sell-side pressure across derivatives venues.

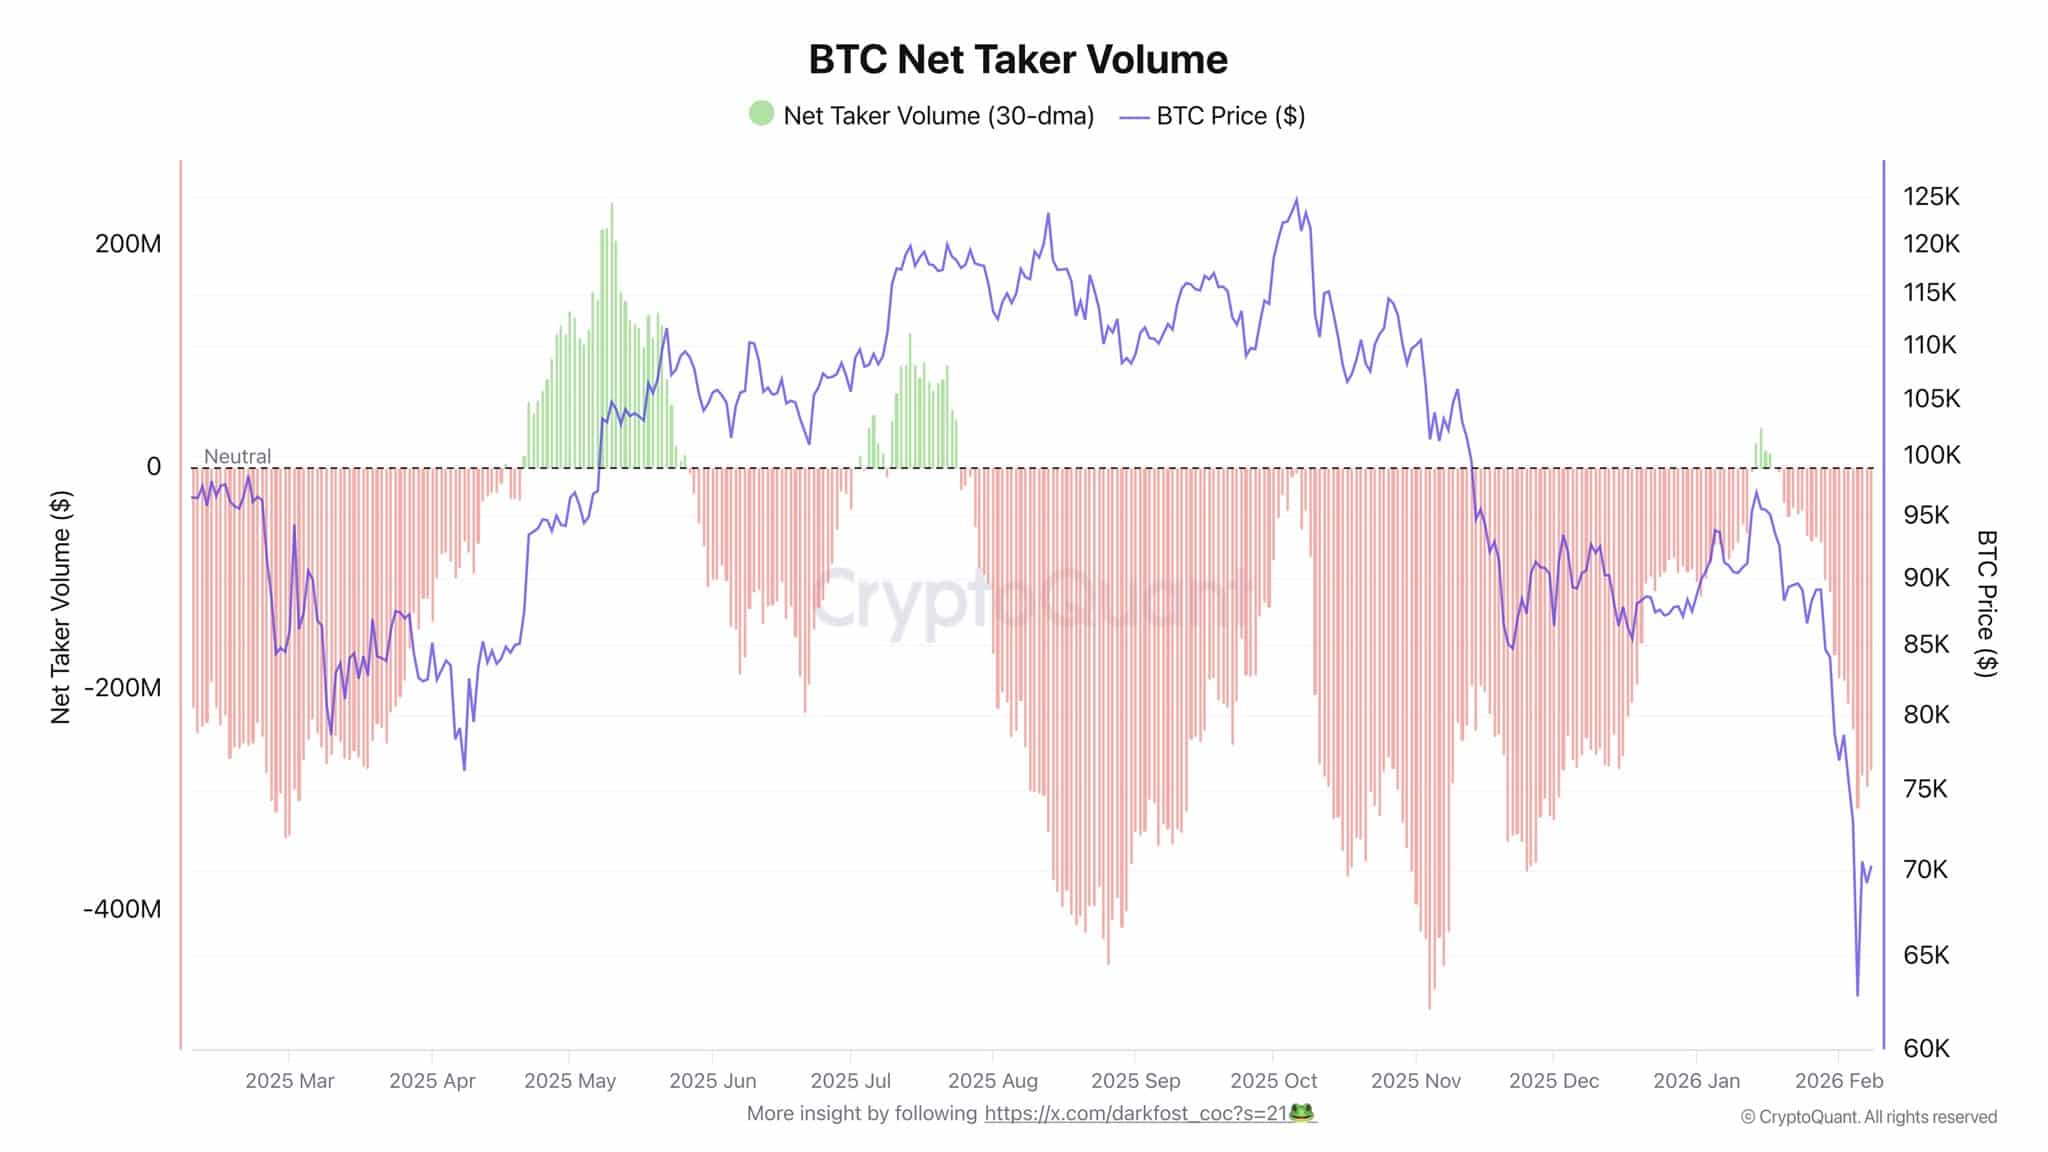
Source: CryptoQuant
The shift is also visible on Binance, which accounts for the majority of Bitcoin derivatives trading. The exchange’s Taker Buy Sell Ratio, a metric used to assess whether aggressive buying or selling dominates, indicated seller control.
The ratio uses 1 as a neutral threshold. Readings above 1 suggest buyer dominance, while values below 1 indicate concentrated selling.
Despite Binance recording $20.3 billion in trading volume, the ratio stood at 0.97. This confirms that taker sell orders continue to dominate.
Long positions persist despite shrinking market liquidity
While derivatives volume favors sellers, positioning data presents a more nuanced picture.
Funding Rates across exchanges have turned slightly positive, suggesting that long traders are paying to maintain their positions. Data from CoinGlass showed a Funding Rate of 0.0010% at press time, indicating expectations of upward price movement.
Positive Funding Rates typically emerge when demand for long exposure increases, often accompanied by elevated speculative activity near key price levels.


Source: CoinGlass
Notably, this concentration of long positions persists even as overall capital in the Bitcoin perpetual futures market declines. at press time, Open Interest (OI), which measures the total value of outstanding contracts, fell by $725 million over the past day.
A decline in OI often reflects reduced risk appetite and uncertainty about near-term price direction. Despite this contraction, traders continue to position for upside, suggesting residual conviction in Bitcoin’s potential for a rebound.
Spot and ETF flows remain a critical variable
Spot market activity and flows into spot Bitcoin ETFs remain essential indicators for any sustained upside.
Recent spot flows have been largely unsupportive of bullish momentum. On the 6th of February, approximately $1.04 billion worth of Bitcoin was sold into the market, marking the largest single-day sell-off in recent weeks, according to CoinGlass. This was followed by a temporary $431 million net buy.
However, additional sell pressure of $177.8 million emerged between the 8th and 9th of February, indicating that bearish activity remains present. Spot activity has yet to return to the consistent, day-to-day dominance observed in December.


Source: Sosovalue
ETF flows mirror this weakness. Spot Bitcoin ETFs have recorded net outflows of $173 million so far this month, marking the fourth consecutive month in which net sales have outweighed inflows.
Until both spot and derivatives markets show sustained bullish participation across short- and long-term horizons, Bitcoin’s momentum is likely to remain subdued.
Final Thoughts
- Market data shows Bitcoin trading volume skewed toward sellers, while capital positioning remains concentrated in long contracts.
- Broader capital inflows into spot Bitcoin have slowed, reinforcing uncertainty around the asset’s next directional move.
Source: https://ambcrypto.com/why-bitcoins-71k-range-looks-fragile-after-725m-oi-drop/