- SOL/BTC has been in decline since mid-January 2025, showing weakening demand
- Sharpe Ratio and NRM metrics indicated growing volatility and potential risk for Solana
Solana’s [SOL] battle against Bitcoin [BTC] has been a thrilling ride, but experts suggest that the tide may be turning. As Solana faces increasing pressure, several key metrics are hinting at a potential bear market for SOL/BTC, reminiscent of the struggles Ethereum [ETH] faced in its own battle with Bitcoin.
With momentum slowing and bearish indicators mounting, are the good times for Solana coming to an end?
State of the SOL/BTC market
The SOL/BTC trading pair has seen a decline in recent weeks, indicative of broader market conditions. In fact, the data highlighted a clear downtrend since mid-January 2025, with the pair dropping from its high of 0.0024 BTC to its press time level near 0.0020 BTC.
A hike in selling pressure and falling trading volumes have exacerbated the drop, signaling weaker demand relative to Bitcoin.
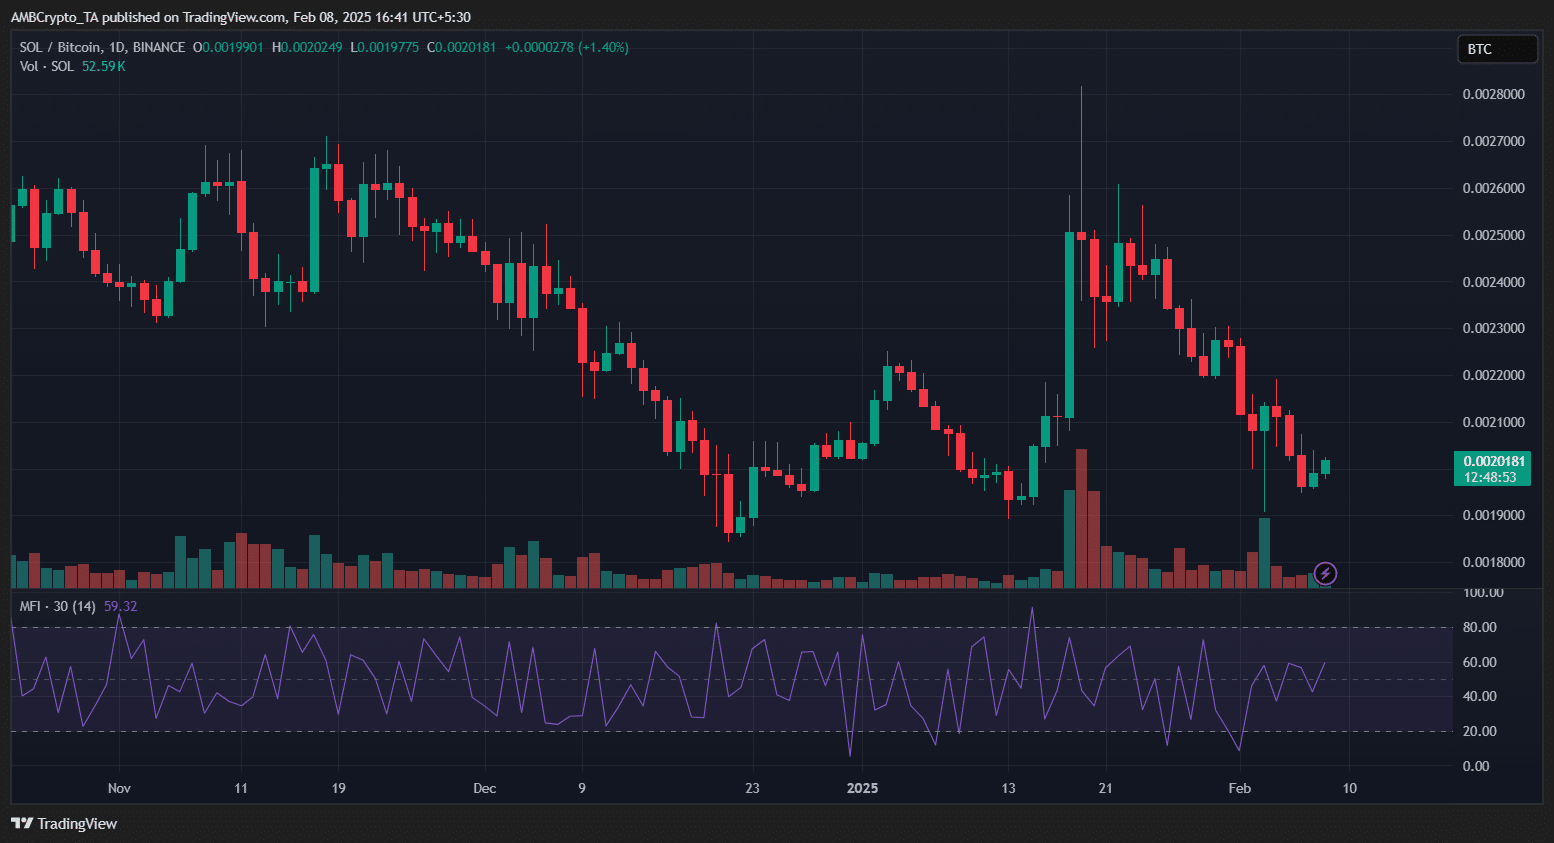

Source: TradingView
Historically, Solana has shown periods of strong outperformance against BTC. However, its current decline aligns with market corrections and fading momentum.
The MFI, for instance, showed a recent uptick, alluding to a possible short-term recovery as buyers cautiously re-enter the market.
SOL/BTC – Sharpe ratio insights
The data highlighted the relationship between the SOL/BTC pair’s price and its Sharpe Ratio. Historically, peaks in the Sharpe Ratio align with price surges, as seen in mid-2021 and mid-2023.
However, sharp declines in this ratio often signal heightened volatility and risk – Coinciding with price downturns.

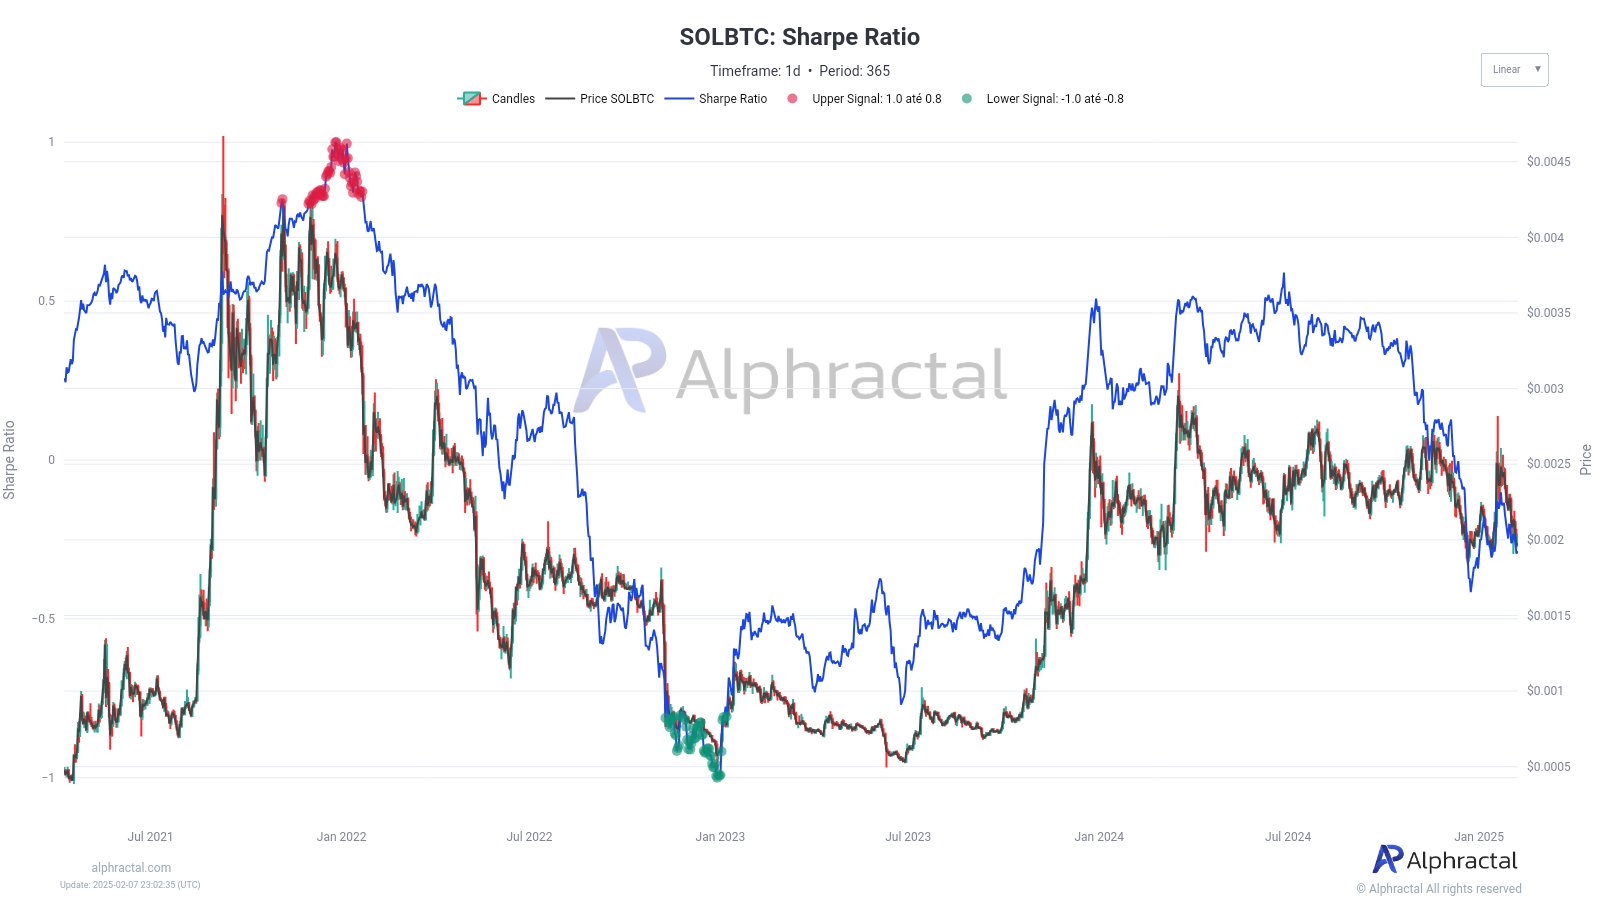
Source: Alphractal
At the time of writing, the Sharpe Ratio was hovering near neutral or negative territory, reflecting diminished risk-adjusted performance for SOL relative to Bitcoin.
This seemed to be in line with the recent price weakness. The pattern pointed to market hesitation, with investors cautious about allocating heavily to SOL during uncertain periods. Unless a notable improvement in risk-reward dynamics occurs, sustained outperformance against Bitcoin might be unlikely in the short term.
Decoding market trends
The Normalized Risk Metric offers a more nuanced perspective though. The NRM oscillates within a gradient band, with higher values in red indicating elevated risk and lower values in blue signaling reduced risk levels.
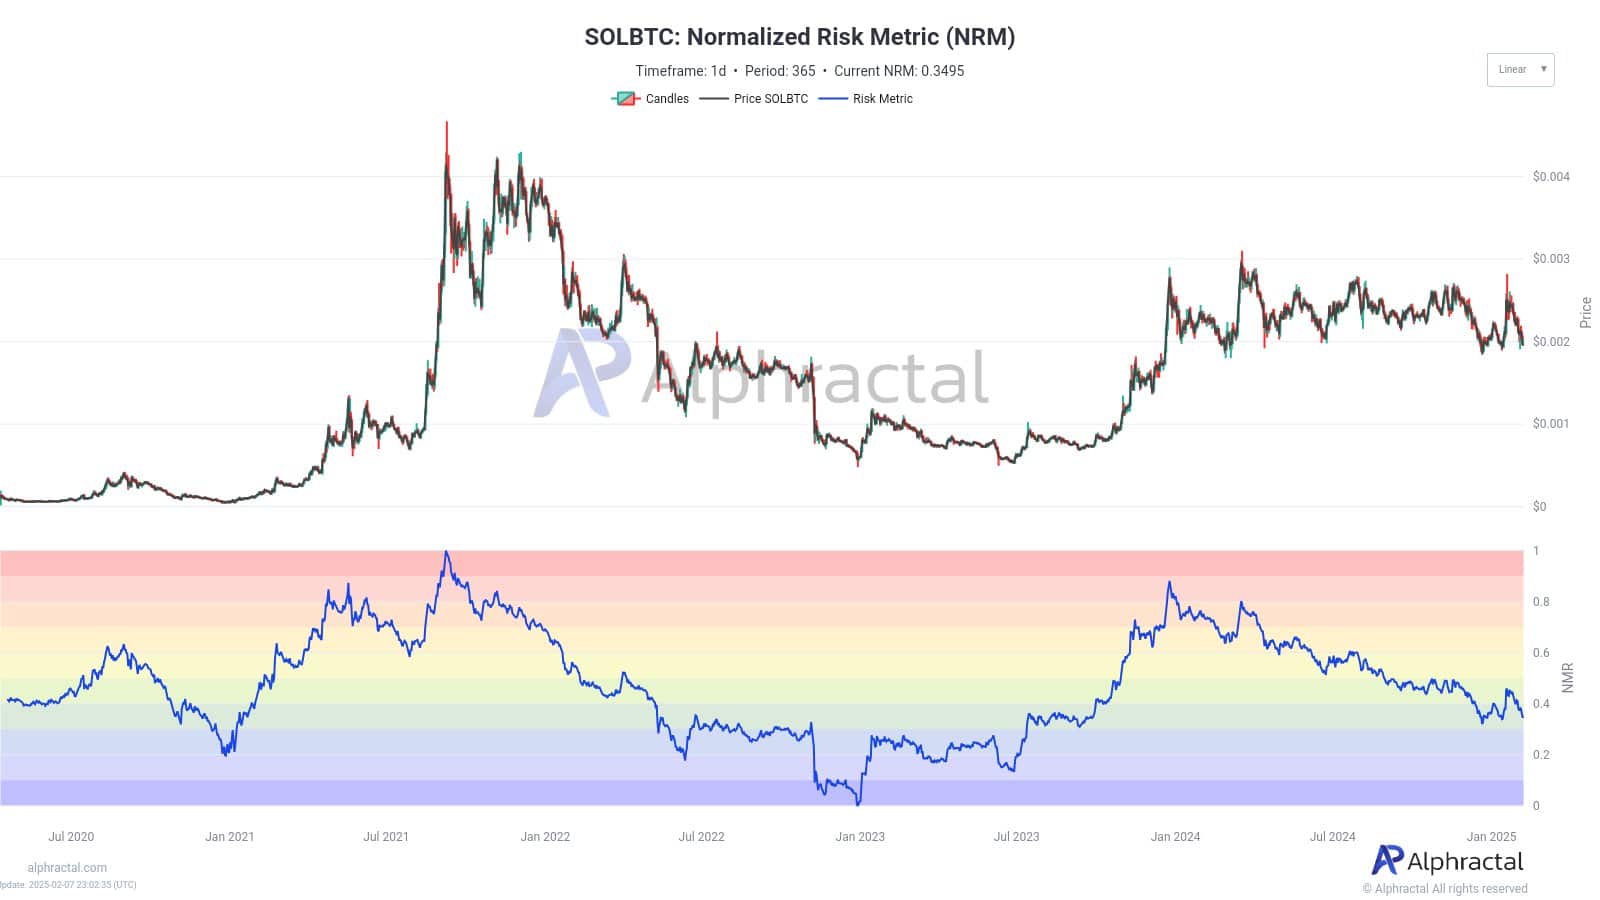

Source: Alphractal
Historically, price peaks coincide with elevated NRM levels, as seen in mid-2021, suggesting overbought conditions and heightened market euphoria. Conversely, dips into the lower bands have marked accumulation phases, such as early 2023, signaling reduced market risk.
Currently, the NRM is hovering in the mid-band, reflecting a more cautious equilibrium. This means that the market is neither overly exuberant nor fearful, hinting at a consolidation phase for SOL relative to Bitcoin.
Comparing SOL/BTC to ETH/BTC
When juxtaposing SOL/BTC with ETH/BTC, distinct divergences emerge in their market behavior. While ETH/BTC traditionally mirrors broader market sentiment as a bellwether for altcoin performance, SOL/BTC underlines higher volatility, reflecting Solana’s position as a high-beta asset.
Ethereum’s stronger risk-adjusted returns highlighted its appeal to institutional and long-term investors. On the contrary, Solana’s sharper fluctuations pointed to greater speculative interest, amplifying both upside potential and downside risks.
ETH/BTC has maintained solid support levels too, reinforcing its status as a portfolio anchor. Meanwhile, SOL/BTC’s frequent excursions into risk zones mean shorter cycles of euphoria and fear, making it more prone to rapid shifts driven by whale activity and ecosystem developments.
Read Solana’s [SOL] Price Prediction 2025–2026
Source: https://ambcrypto.com/solanas-momentum-against-bitcoin-weakens-explained/