Bitcoin Analysis
Bitcoin’s price finished the week’s final daily session with a green candle and was +$238 on Sunday.
The BTC/USD 1W chart below by AlanSantana is the first chart we’re delving into this week. Bitcoin’s price is trading between the 0.148 fibonacci level [$16,924.4] and 0.236 fib level [$17,773.0], at the time of writing.
The chartist denotes they’re long and the targets on that journey are 0.236, 0.382 [$19,180.8], 0.5 [$20,318.7], 0.618 [$21,456.6], 0.786 [$23,076.6], 1.236 [$27,415.9] and 1.382 fib level [$28,823.8] over the short-term.
Contrariwise, bearish traders of the Bitcoin market have a primary target of the 0.148 fib level with a secondary target of the asset’s 12-month low of $15,504.7.
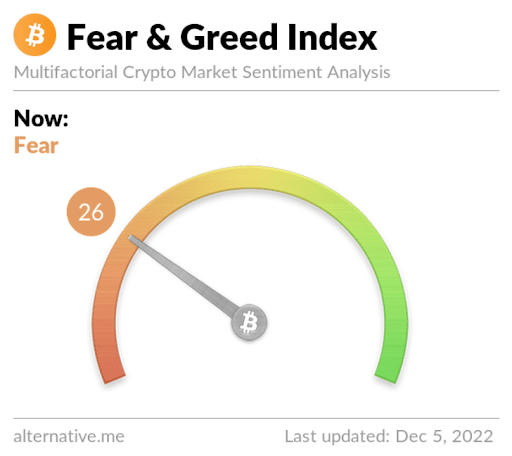
The Fear and Greed Index is 26 Fear and is even to Sunday’s reading.

Bitcoin’s Moving Averages: 5-Day [$16,740.38], 20-Day [$16,890.86], 50-Day [$18,603.11], 100-Day [$20,119.91], 200-Day [$26,733.29], Year to Date [$29,089.47].
BTC’s 24 hour price range is $16,885-$17,210 and its 7 day price range is $16,143.63-$17,227.39. Bitcoin’s 52 week price range is $15,501-$52,027.
The price of Bitcoin on this date last year was $49,469.
The average price of BTC for the last 30 days is $17,350.8 and its -16% over the same interval.
Bitcoin’s price [+1.41%] closed its daily candle worth $17,128 on Sunday and in positive figures for the second time over the last three days.
Ethereum Analysis
Ether’s price also marked-up during Sunday’s candle and when traders settled-up for the day, ETH’s price was +$39.29.
The second chart we’re looking at for this Monday is the ETH/USD 4HR chart from zippy1day. At the time of writing, Ether’s price is trading between the 0.618 fib level [$1,242.94] and 1 fib level [$1,301.61].
Overhead those longing the ETH market are aiming for 1 [$1,301.61], 1.618 [$1,401.61], 1.75 [$1,424.02], 2 [$1,424.02], and the 2.236 fib level [$1,509.64] in the interim.
Bearish Ether traders are conversely seeking to push ETH’s price below the 0.618 fib level with a secondary aim of a full retracement at 0 [$1,154.00].
Ether’s Moving Averages: 5-Day [$1,251.11], 20-Day [$1,237.27], 50-Day [$1,329.12], 100-Day [$1,473.89], 200-Day [$1,863.51], Year to Date [$2,047.20].
ETH’s 24 hour price range is $1,240.1-$1,287.19 and its 7 day price range is $1,163.39-$1,300.96. Ether’s 52 week price range is $883.62-$4,482.76.
The price of ETH on this date in 2021 was $4,194.6.
The average price of ETH for the last 30 days is $1,278.1 and its -17.39% over the same span.
Ether’s price [+3.17%] closed its daily session on Sunday worth $1,279.73 and in green digits also for the second time in three days.
Binance Coin Analysis
Binance Coin’s price has finished in positive figures for two of the last three daily sessions as well and when the day’s candle was printed, BNB’s price was +$1.8 on Sunday.
The BNB/USD 4HR chart below from KaushalSonic is the final chart for analysis this Monday.
Binance Coin’s price is trying to break out of a Triangle pattern on the 4HR timescale. BNB’s price is bull flagging and for bullish traders to break out to the upside they need to eclipse the $292.4 level.
Bearish traders conversely want to retest the bottom of this structure at the $285.5 level.

BNB’s 24 hour price range is $287.4-$292.8 and its 7 day price range is $287.4-$308.13. Binance Coin’s 52 week price range is $184.1-$616.2.
Binance Coin’s price on this date last year was $557.6.
The average price of BNB over the last 30 days is $295.52 and its -8.99% over the same duration.
Binance Coin’s price [+0.62%] closed its daily session on Sunday worth $292.2.
Source: https://en.cryptonomist.ch/2022/12/05/bitcoin-17k-ethereum-1-2k-binance-coin-price-analyses/

