Bitcoin Analysis
Bitcoin’s price continued to make higher lows over the weekend and when traders settled-up on Sunday, BTC’s price was +$26.60.
The first chart we’re digging into for this new week is the BTC/USD 4HR chart below by mknight2690. BTC’s price is trading between the 0.382 fibonacci level [$19,551.27] and 0.5 [$19,724.21], at the time of writing.
Bullish traders again failed to close the weekly time frame on Sunday above arguably the most important level of inflection in Bitcoin’s history and its former 2017 all-time high [$19,891]. Their targets to the upside are now 0.5, 0.618 [$19,897.15], 1 [$20,457.00], 1.13 [$20,647.53], 1.414 [$21,063.76] and 1.618 [$21,362.74].
Conversely, bearish traders are trying to push Bitcoin’s price again below the $19k level. Their targets to the downside of the chart are 0.382, 0.236 [$19,337.29], and a full retracement from the most recent bullish breakout at 0 [$18,991.41].
The Fear and Greed Index is 22 Extreme Fear and is equal to Sunday’s reading.

Bitcoin’s Moving Averages: 5-Day [$19,906.81], 20-Day [$19,696.98], 50-Day [$21,006.49], 100-Day [$22,457.03], 200-Day [$21,237.68], Year to Date [$31,237.68].
BTC’s 24 hour price range is $19,316-$19,558 and its 7 day price range is $19,077.99-$20,420.51. Bitcoin’s 52 week price range is $17,611-$69,044.
The price of Bitcoin on this date last year was $54,701.
The average price of BTC for the last 30 days is $19,785.5 and it’s +1.2% over the same stretch.
Bitcoin’s price [+0.14%] closed its daily candle worth $19,441.2 and back in green figures on Sunday for the first time in five days.
Ethereum Analysis
Ether’s price also finished-up Sunday’s trading session less than 1% up and +$8.37.
The ETH/USD 1W chart from mohammadalisokhankhosh is the second chart we’re looking at for Monday. ETH’s price is trading between the 0.786 fib level [$1,112.21] and 0.618 [$1,916.44], at the time of writing.
ETH’s price has been perpetually sliding down its charts since The Merge took place last month and bulls are hoping to regain the 0.618 to stop the bleeding. Above the 0.618, the targets for bullish Ether market participants are 0.5 [$2,481.31], 0.382 [$3,046.19], 0.236 [$3,745.10], and back to retest 2021’s ATH on the BitStamp chart at 0 [$4,874.85].
At variance with bulls are bearish traders that are looking to inflict further pain to bullish market participants. They’ve targets of 0.786 [$1,112.21], and 1 [$87.21].
Ether’s Moving Averages: 5-Day [$1,345.44], 20-Day [$1,395.69], 50-Day [$1,573.36], 100-Day [$1,507.05], 200-Day [$2,191.34], Year to Date [$2,191.34].
ETH’s 24 hour price range is $1,307.26-$1,329 and its 7 day price range is 1,281.54-$1,383.46. Ether’s 52 week price range is $883.62-$4,878.
The price of ETH on this date in 2021 was $3,414.72.
The average price of ETH for the last 30 days is $1,417.5 and it’s -18.76% over the same period.
Ether’s price [+0.64%] closed its daily candle on Sunday worth $1,323.42 and in green digits again for the first time in three daily sessions.
Quant Analysis
Quant’s price continued to climb over the weekend and when Sunday’s daily session wrapped-up, QNT’s price was +$6.6.
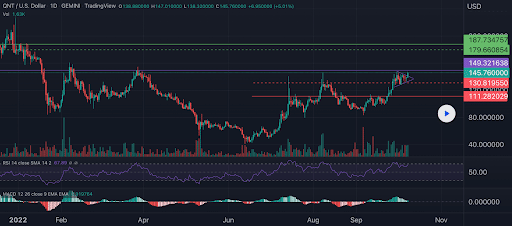
The QNT/USD 1D chart below from RighteousTA shows the most important levels in the interim for Quant market participants.
We can see that QNT’s price closed Sunday above another inflection point at the $149.32 level and that the $179.66 level and the $187.73 level are the next targets for bullish traders.
From the perspective of bears, they’re looking to push QNT’s price below the $149.32 level followed by targets of $145.76, $130.81, and $111.28.

Quant’s price is +95.41% against The U.S. Dollar for the last 90 days months, +106.6% against BTC, and +70.29% against ETH, over the same duration.
Quant’s 24 hour price range is $148.9-$163.9 and its 7 day price range is $130.89-$163.9. QNT’s 52 week price range is $40.5-$328.3.
Quant’s price on this date last year was $294.
The average price of QNT over the last 30 days is $119.93 and its +65.06% over the same time frame.
Quant’s price [+4.42%] closed its trading session on Sunday valued at $156 and in green figures for a third consecutive day.
Source: https://en.cryptonomist.ch/2022/10/10/bitcoin-19k-ethereum-1-3k-quant-price-analyses/

