
Renowned trader Peter Brandt has raised eyebrows across the crypto community with a stark warning: Bitcoin’s current price action may be mirroring the setup seen in November 2021—just before the market’s last major top and extended correction.
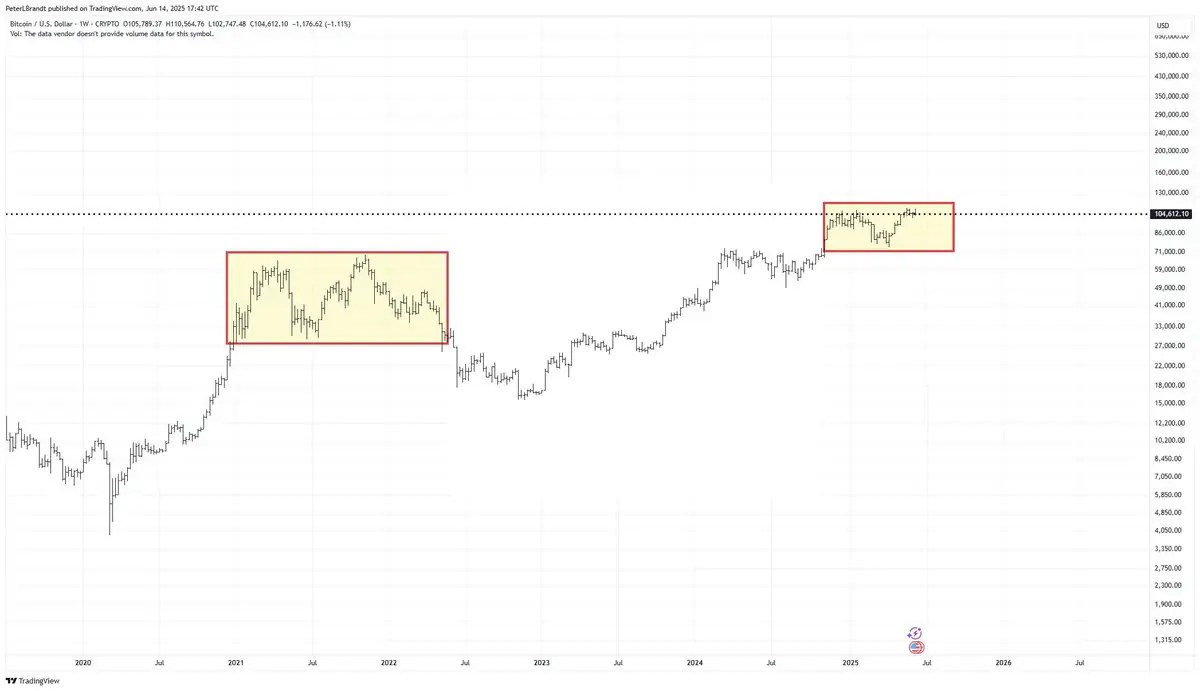
In a recent chart post, Brandt highlighted two eerily similar price structures. The left box captures the distribution pattern that formed around Bitcoin’s all-time high in late 2021, while the right box outlines the current consolidation range near $105K–$110K.
Both show price stalling near record levels after sharp rallies, forming sideways ranges that could suggest trend exhaustion.
Why It Matters
Brandt’s comparison is not casual. The 2021 top led to a prolonged bear market and a more than 70% drawdown. His visual echo of the past implies caution: if the current range breaks down, BTC could once again face a deep correction.
While he stops short of calling this a confirmed top, the question — “November 2021 all over again?” — implies that investors should stay alert for a potential trend reversal.
Market Context
- Bitcoin is currently trading just below $105K, struggling to break through the $108K resistance zone.
- Weekly candles have shown indecision and large wicks, reinforcing uncertainty.
- Open interest and on-chain flows remain stable, but macro and sentiment risks are building.
Key Takeaway
Brandt’s chart doesn’t confirm a crash, but it’s a warning that current conditions resemble a critical moment in BTC history. If this pattern repeats, the coming weeks could define the next macro move—whether it’s consolidation, breakout, or breakdown. Traders should remain vigilant.

Kosta Gushterov
Reporter at Coindoo
Kosta has been a part of the team since 2021 and has solidified his position with a thirst for knowledge, incredible dedication to his work and a “detective-like” mindset. He not only covers a wide range of trending topics, he also creates reviews, PR articles and educational content. His work has also been referenced by other news outlets.
Source: https://coindoo.com/peter-brandt-compares-current-bitcoin-structure-to-2021-top-is-history-repeating/