With Bitcoin (BTC) plunging below the $66,000 mark, analysts indicate that the maiden digital asset will likely see extended losses in the coming days.
Particularly, crypto trading expert TradingShot, through a TradingView post on June 17, noted that investors should watch how Bitcoin interacts with the 50-day moving average (1D MA50) at around $66,100, which previously served as support.
As per the analysis, Bitcoin’s failure to reclaim the 1D MA50 as support should cause investors to prepare for a potential drop to around $61,000, marking the upper boundary of the support zone. Further weakness below $61,000 could signal a deeper decline towards $56,000, near the 1D MA200, potentially forming a long-term bottom.
“If on the other hand BTC closes a 1D candle below the underlying trend-line, prepare for 61000 (top of Support Zone) and potentially a long-term bottom formation on the 1D MA200,” the expert noted.
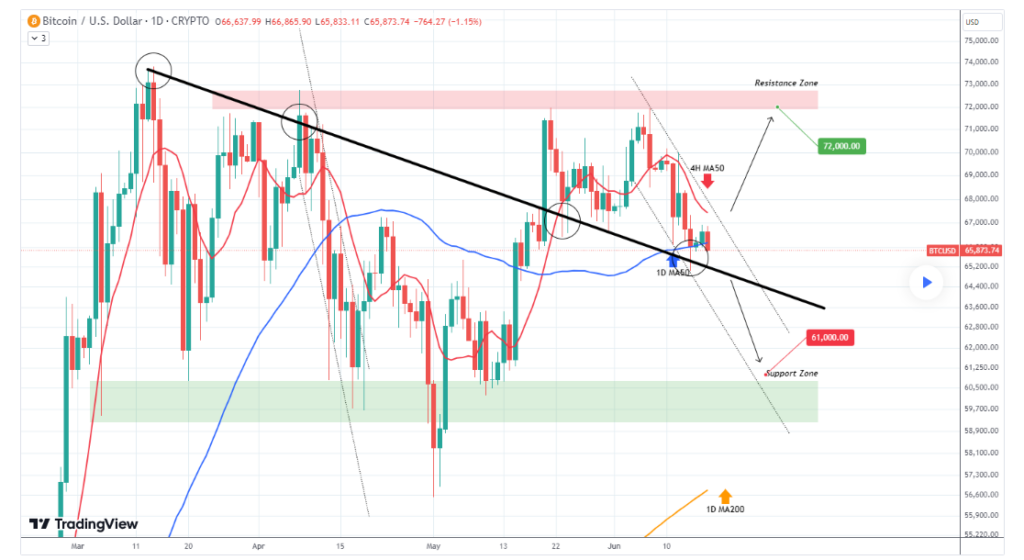
The analyst highlighted the importance of the 1D MA50 as a support level, noting Bitcoin’s consistent daily closures above it since Friday. Practically, the expert suggested that maintaining above the 1D MA50 could provide a bullish signal if Bitcoin aims for $72,000, the lower boundary of the resistance zone.
“On the previous Bearish Leg (April 08 – May 01) of this 3-month consolidation structure, the price remained bearish as long as it stayed below the 1D MA50. The 4H MA50 never broke to the upside while the price was above the 1D MA50. That is why it will be a bullish signal if it breaks while BTC is above the 1D MA50,” the expert added.
Below hits the monthly low
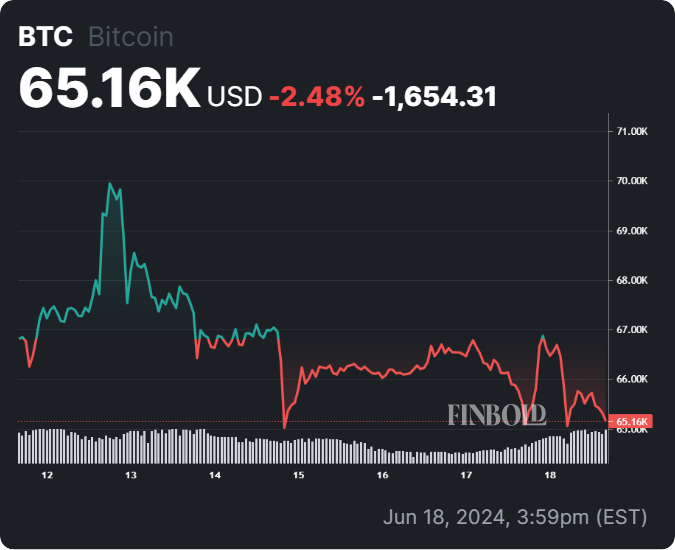
However, in the short term, the crypto is struggling to hold above $65,000, having slipped below the $67,000 mark. The short-term bearish momentum resulted in Bitcoin dropping to a monthly low of around $64,000.
It’s worth noting that Bitcoin has experienced volatility over the past seven days, partly due to significant outflows from a US-based spot exchange-traded fund (ETF). At the same time, the latest correction has seen Bitcoin affected by political uncertainty, mainly stemming from France’s surprise election decision.
This political situation has strengthened the dollar, a factor that has historically applied pressure on Bitcoin and altered its previous trajectory toward the $70,000 mark
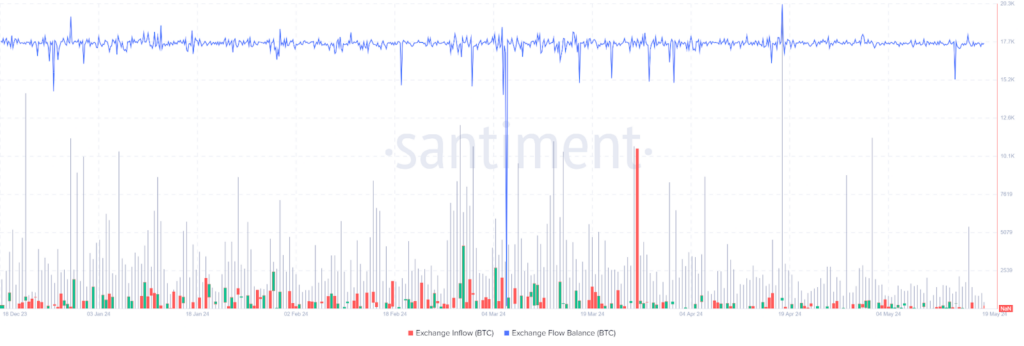
Additionally, on-chain data reflects the heightened volatility of Bitcoin. According to Santiment, a market intelligence platform, Bitcoin’s exchange inflow has spiked, rising 137% in the past day from 19,172 BTC to 45,356 BTC.
Concurrently, there has been an increase in Bitcoin leaving exchanges, with outflows surging 119% from 19,871 BTC to 43,493 BTC over the same period. This uptick in exchange activity suggests more investors are transferring Bitcoin to exchanges, potentially in anticipation of selling during the bearish trend.
Bitcoin price analysis
By press time, Bitcoin remains down 0.5% on the daily chart, trading at $65,160. Over the past seven days, the asset has declined by over 2%.
With Bitcoin having lost support at $66,000, all eyes are now on the bulls to attempt to influence the price amidst an increasingly bearish scenario.
Disclaimer: The content on this site should not be considered investment advice. Investing is speculative. When investing, your capital is at risk.
Source: https://finbold.com/beware-more-bitcoin-capitulation-ahead-if-this-level-fails-to-hold/