Legendary trader Peter Brandt recently discussed the current price action of Bitcoin, highlighting his risky bet on an uptrend amid a bearish signal.
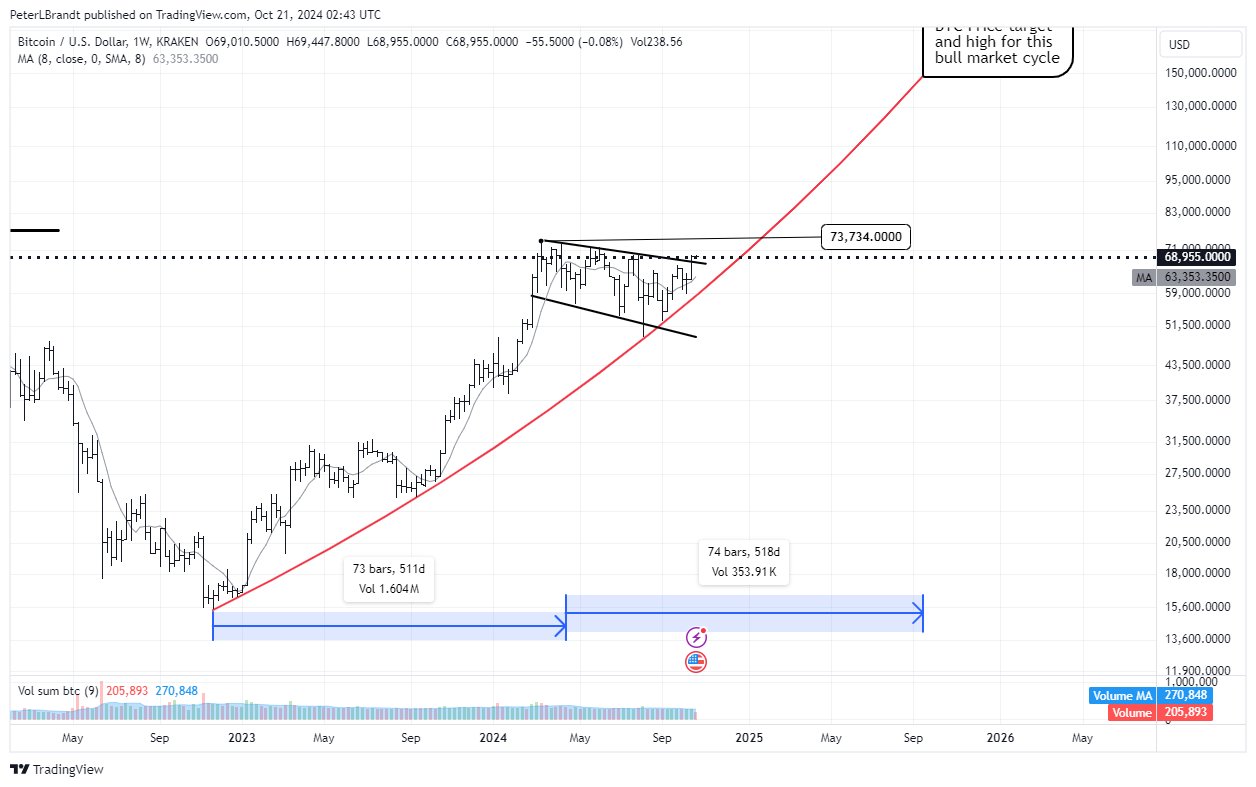
In an analysis published on October 21, Brandt identified a seven-month inverted expanding triangle formation that continues to shape Bitcoin’s price behavior. This pattern, also known as a “broadening formation,” has been unfolding since March, when Bitcoin reached its historic high.
The formation consists of two sloping trendlines that diverge over time, creating a broadening shape. It arises amid a series of lower lows and lower highs amid Bitcoin’s seven-month-long consolidation.

Notably, the inverted broadening triangle observed on Bitcoin’s chart is typically a bearish signal. Brandt first called attention to the pattern in July.
In his latest analysis, he stressed that the formation has not been violated despite Bitcoin’s consistent uptrend since last month. This signals caution regarding the current trend. Meanwhile, Brandt disclosed that he is taking a risky bet on Bitcoin.
https://x.com/thecryptobasic
Brandt is Long on Bitcoin, Targets $150K
Specifically, despite the bearish signal, the seasoned trader noted that he is currently long on Bitcoin. He acknowledged that being long on Bitcoin at this time is his most considerable speculative position.
He posted a chart highlighting his anticipated target for Bitcoin in this cycle at the lofty $150K level, which he expects to materialize by September 2025.
At the time of the analysis on Monday, Bitcoin traded as high as $69,500. Meanwhile, at press time, Bitcoin is at $66,293, down 2% today alone.
In an earlier analysis, the veteran trader highlighted the significance of Bitcoin moving over the $72K price point to confirm whether Bitcoin’s month-long uptrend is sustainable in setting higher highs or whether a corrective downturn could emerge.
However, Bitcoin has failed to hit $70K, and a correction phase is in progress, with ongoing attempts to breach the $65K level.
Brandt Says Technical Analysis Can Be Worthless
Interestingly, in a more recent update, Brandt stated that trend lines in technical price chart analysis are essentially worthless.
He pointed out that even the clearest and most accurately drawn price patterns are reliable only about 60% of the time. According to him, the true value of price charts lies in risk management and identifying asymmetric trading opportunities.
In technical price chart analysis, trend lines are basically worthless. Even the clearest and most legitimately drawn area price patterns are only reliable about 60% of the time.
The worth of price charts is for risk management and to identify asymmetric trades pic.twitter.com/FH8UGIgzH8— Peter Brandt (@PeterLBrandt) October 22, 2024
DisClamier: This content is informational and should not be considered financial advice. The views expressed in this article may include the author’s personal opinions and do not reflect The Crypto Basic opinion. Readers are encouraged to do thorough research before making any investment decisions. The Crypto Basic is not responsible for any financial losses.
Source: https://thecryptobasic.com/2024/10/23/legendary-analyst-brandt-spots-bearish-bitcoin-signal-but-longs-btc-with-150k-target/?utm_source=rss&utm_medium=rss&utm_campaign=legendary-analyst-brandt-spots-bearish-bitcoin-signal-but-longs-btc-with-150k-target
