As Bitcoin (BTC) attempts to hold the $115,000 support, an analyst has noted that the asset is facing a pivotal scenario likely to influence its price trajectory following the anticipated Federal Reserve rate cut.
The analysis by TradingShot was based on Bitcoin’s four-hour chart, where a golden cross has formed as the 50-period moving average (MA50) crossed above the 200-period moving average (MA200), a bullish signal often marking the start of uptrends.
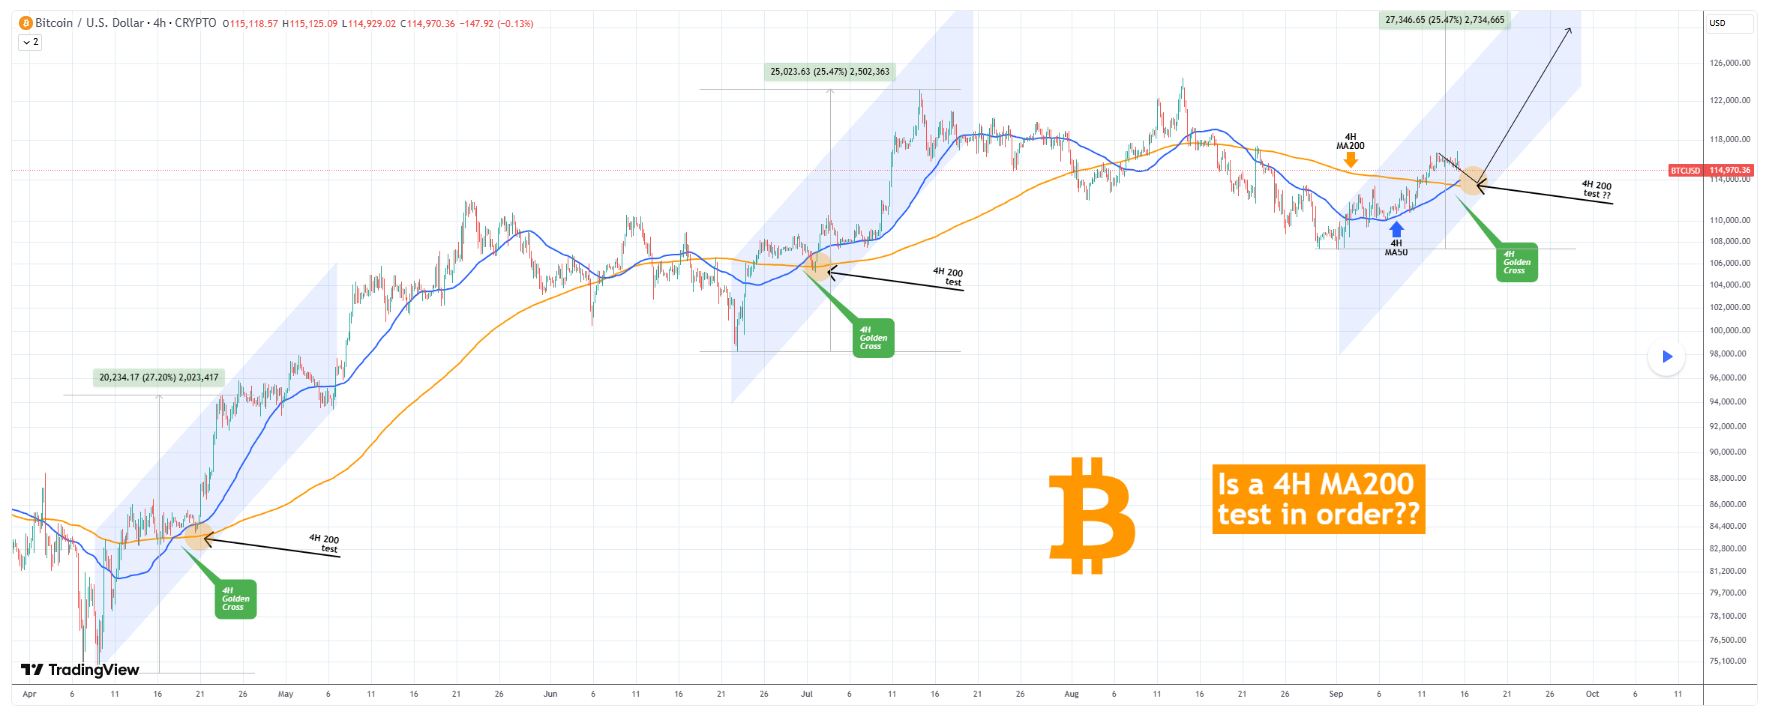
In a TradingView post on September 16, TradingShot noted that the setup comes with a catch. Historical price action shows that after each four-hour golden cross since the April 7 bottom, Bitcoin has consistently pulled back to retest its 200-period MA before resuming higher.
This historical context puts $113,600 in focus, making it a potential magnet for short-term volatility.
The outlook also highlighted that these retests have occurred within broader rising channels, with each correction paving the way for rallies of more than 25%.
If the pattern repeats, Bitcoin could dip to test the four-hour MA200 at around $113,000 before pushing toward new highs and potentially extending the current uptrend.
Overall, with the Fed’s rate cut fueling speculation of looser financial conditions, Bitcoin could benefit from increased liquidity and risk appetite, though it may also face volatility as traders reassess macroeconomic conditions.
Bitcoin price analysis
At press time, Bitcoin was trading at $115,290, up about 0.44% on the day and more than 2% over the past week.

Amid the projected volatility, Bitcoin is holding above its 50-day simple moving average (SMA) of $114,626 and well above the 200-day SMA of $103,071, a setup that supports the broader bullish trend.
Meanwhile, the 14-day relative strength index (RSI) at 56.98 signals balanced momentum, suggesting the market still has room to extend gains without immediate risk of reversal.
Featured image via Shutterstock
Source: https://finbold.com/heres-what-next-for-bitcoin-after-the-feds-rate-cut/