Current price analysis: Bitcoin (BTC)
The current price of Bitcoin had a pretty quiet daily session on Tuesday and bulls failed to invalidate Monday’s bearish engulfing candle. Despite that fact, bulls successfully painted BTC’s largest bullish engulfing candle on the monthly timescale since October of 2021 and when traders settled-up to close Tuesday’s daily session, BTC’s price was +$303.
The BTC/USD 1M chart below by danfly is where we’re beginning this Wednesday’s price analyses. BTC’s price is trading between the 0.236 fibonacci level [$16,351.70] and the 0.382 fib level [$26,260.70], at the time of writing.
Bullish BTC market participants concluded their strongest monthly performance in 16 months on Tuesday and are eying further upside. Their targets on BTC above are 0.382, 0.5 [$34,269.34], 0.618 [$42,277.98], 0.786 [$53,680.12], and the 1 fibonacci level [$68,204.26].
Conversely, bearish BTC traders are looking to reverse course and negate the positive start to 2023 by bulls. Bearish BTC traders have targets of 0.236 and full retracement at the 0 fib level [$334.42].
The Fear and Greed Index is 56 Greed and is +5 from yesterday’s reading of 51 Neutral.

Bitcoin’s Moving Averages: 5-Day [$23,132.26], 20-Day [$20,475.16], 50-Day [$18,292.15], 100-Day [$18,707.04], 200-Day [$21,930.76], Year to Date [$20,132.21].
BTC’s 24 hour price range is $22,500-$23,221.1 and its 7 day price range is $22,500-$23,753.1. Bitcoin’s 52 week price range is $15,505-$48,162.9.
The price of Bitcoin on this date last year was $38,699.5.
The average price of BTC for the last 30 days is $20,019.1 and its +39% over the same timespan.
Bitcoin’s price [+1.33%] closed its daily candle worth $23,140 and in green figures for the second time over the last three days on Tuesday.
Ethereum Analysis
Ether’s price also bullishly engulfed the monthly timescale and finished January back above ETH’s cycle-top high from 2018. ETH’s price concluded Tuesday’s daily candle +$18.75.
The second chart on the docket for today is the ETH/USD 1D chart from PaperBozz. At the time of writing, ETH’s price is trading between the 0.786 fibonacci level [$1,430.23] and the 0.618 fib level [$1,886.54].
The targets overhead for bullish Ether traders are 0.618, 0.5 [$2,207.04], 0.382 [$2,527.54] and the 0.236 fib level [$2,924.03].
At variance with bulls are bearish traders of the Ether market that have a primary target of 0.786. If bears can successfully push ETH’s price below the 0.786 their targets are 1 [$848.99] and the 1.272 fib level [$110.21].
Ether’s Moving Averages: 5-Day [$1,593.98], 20-Day [$1,486.20], 50-Day [$1,331.72], 100-Day [$1,348.86], 200-Day [$1,527.52], Year to Date [$1,461.58].
ETH’s 24 hour price range is $1,561.63-$1,605.18 and its 7 day price range is $1,555.97-$1,646. Ether’s 52 week price range is $883.62-$3,579.96.
The price of ETH on this date in 2022 was $2,786.91.
The average price of ETH for the last 30 days is $1,450.11 and its +32.31% over the same interval.
Ether’s price [+1.20%] closed its daily candle on Tuesday worth $1,585.25 and also in green digits for the second time over the last three daily trading sessions.
Polygon Analysis
Polygon’s price also climbed higher on Tuesday and finished its daily session +$0.022.
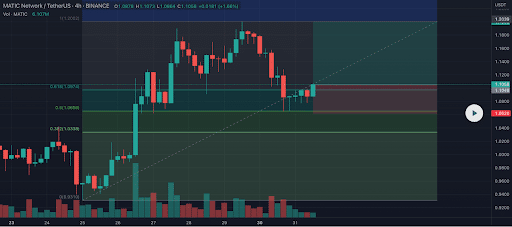
The final chart for analysis today is the MATIC/USDT 4HR chart via Cryptobees_buzz. Polygon’s price is trading between the 0.618 fibonacci level [$1.0974] and the 1 fib level [$1.2002], at the time of writing.
MATIC’s price rattled off four consecutive daily candle closes above the 0.618 fib level but lost that level during Monday’s daily session. Bulls regained that level on Tuesday and are aiming to go and retest the 1 fib level next.
Bearish traders firstly want to push MATIC’s price below the 0.618 with a secondary aim of 0.5 [$1.0656] and a third target of 0.382 [$1.0338]. If bears can really reclaim the Polygon market’s price action then they’ll eventually get to a complete retracement at the 0 fibonacci level [$0.9310].
Polygon’s Moving Averages: 5-Day [$1.09], 20-Day [$0.958], 50-Day [$0.891], 100-Day [$0.877], 200-Day [$0.814], Year to Date [$0.942].
Polygon’s 24 hour price range is $1.07-$1.12 and its 7 day price range is $0.944-$1.17. MATIC’s 52 week price range is $0.317-$2.08.
Polygon’s price on this date last year was $1.64.
The average price of MATIC over the last 30 days is $0.938 and its +43.51% over the same period.
Polygon’s price [+2.09%] closed its daily candle on Tuesday worth $1.10.
Source: https://en.cryptonomist.ch/2023/02/01/current-price-bitcoin-analysis-matic/


