- Bitcoin faced a critical resistance at $102,350, with strong support around $96,147.
- Market sentiment remained balanced as transaction volume declined, indicating possible short-term volatility.
Bitcoin [BTC] has recently reclaimed a critical support zone between $96,475 and $99,360, signaling potential bullish momentum.
At press time, Bitcoin’s price was at $98,079.85, reflecting a 0.91% drop over the past 24 hours.
Despite this minor decline, Bitcoin’s overall momentum remained strong, especially with the $102,350–$103,900 supply wall in sight. If Bitcoin breaks through this level, we could see the next phase of its bullish cycle.
What does Bitcoin’s chart reveal?
The king coin’s price chart showed an incoming inverted head and shoulder pattern, which is often seen as a bullish signal. The price has consolidated between $96,147 and $102,806, forming a critical resistance zone.
Bitcoin is testing this zone, and if it holds above $96,147, it could break through the $102,350–$103,900 region, pushing towards $104,000.
Additionally, the Relative Strength Index (RSI) was at 44.45 at press time, indicating that BTC was approaching oversold conditions.
Thus, Bitcoin may experience a short-term pullback or consolidation before gaining enough strength to break the $102,350 supply wall.


Source: TradingView
What is the NVT Golden Cross telling us?
The NVT Golden Cross indicator, which measures Bitcoin’s network value to transaction volume, showed a 24-hour percentage change of -23.09%.
This indicated a decline in transaction volume relative to BTC’s price increase, suggesting that the rally may not be fully supported by network activity.
Although BTC remained bullish, the lack of sufficient transaction volume could signal that the rally may lose steam.
Therefore, if transaction volume does not pick up soon, Bitcoin may experience a brief pullback before resuming its upward trend.
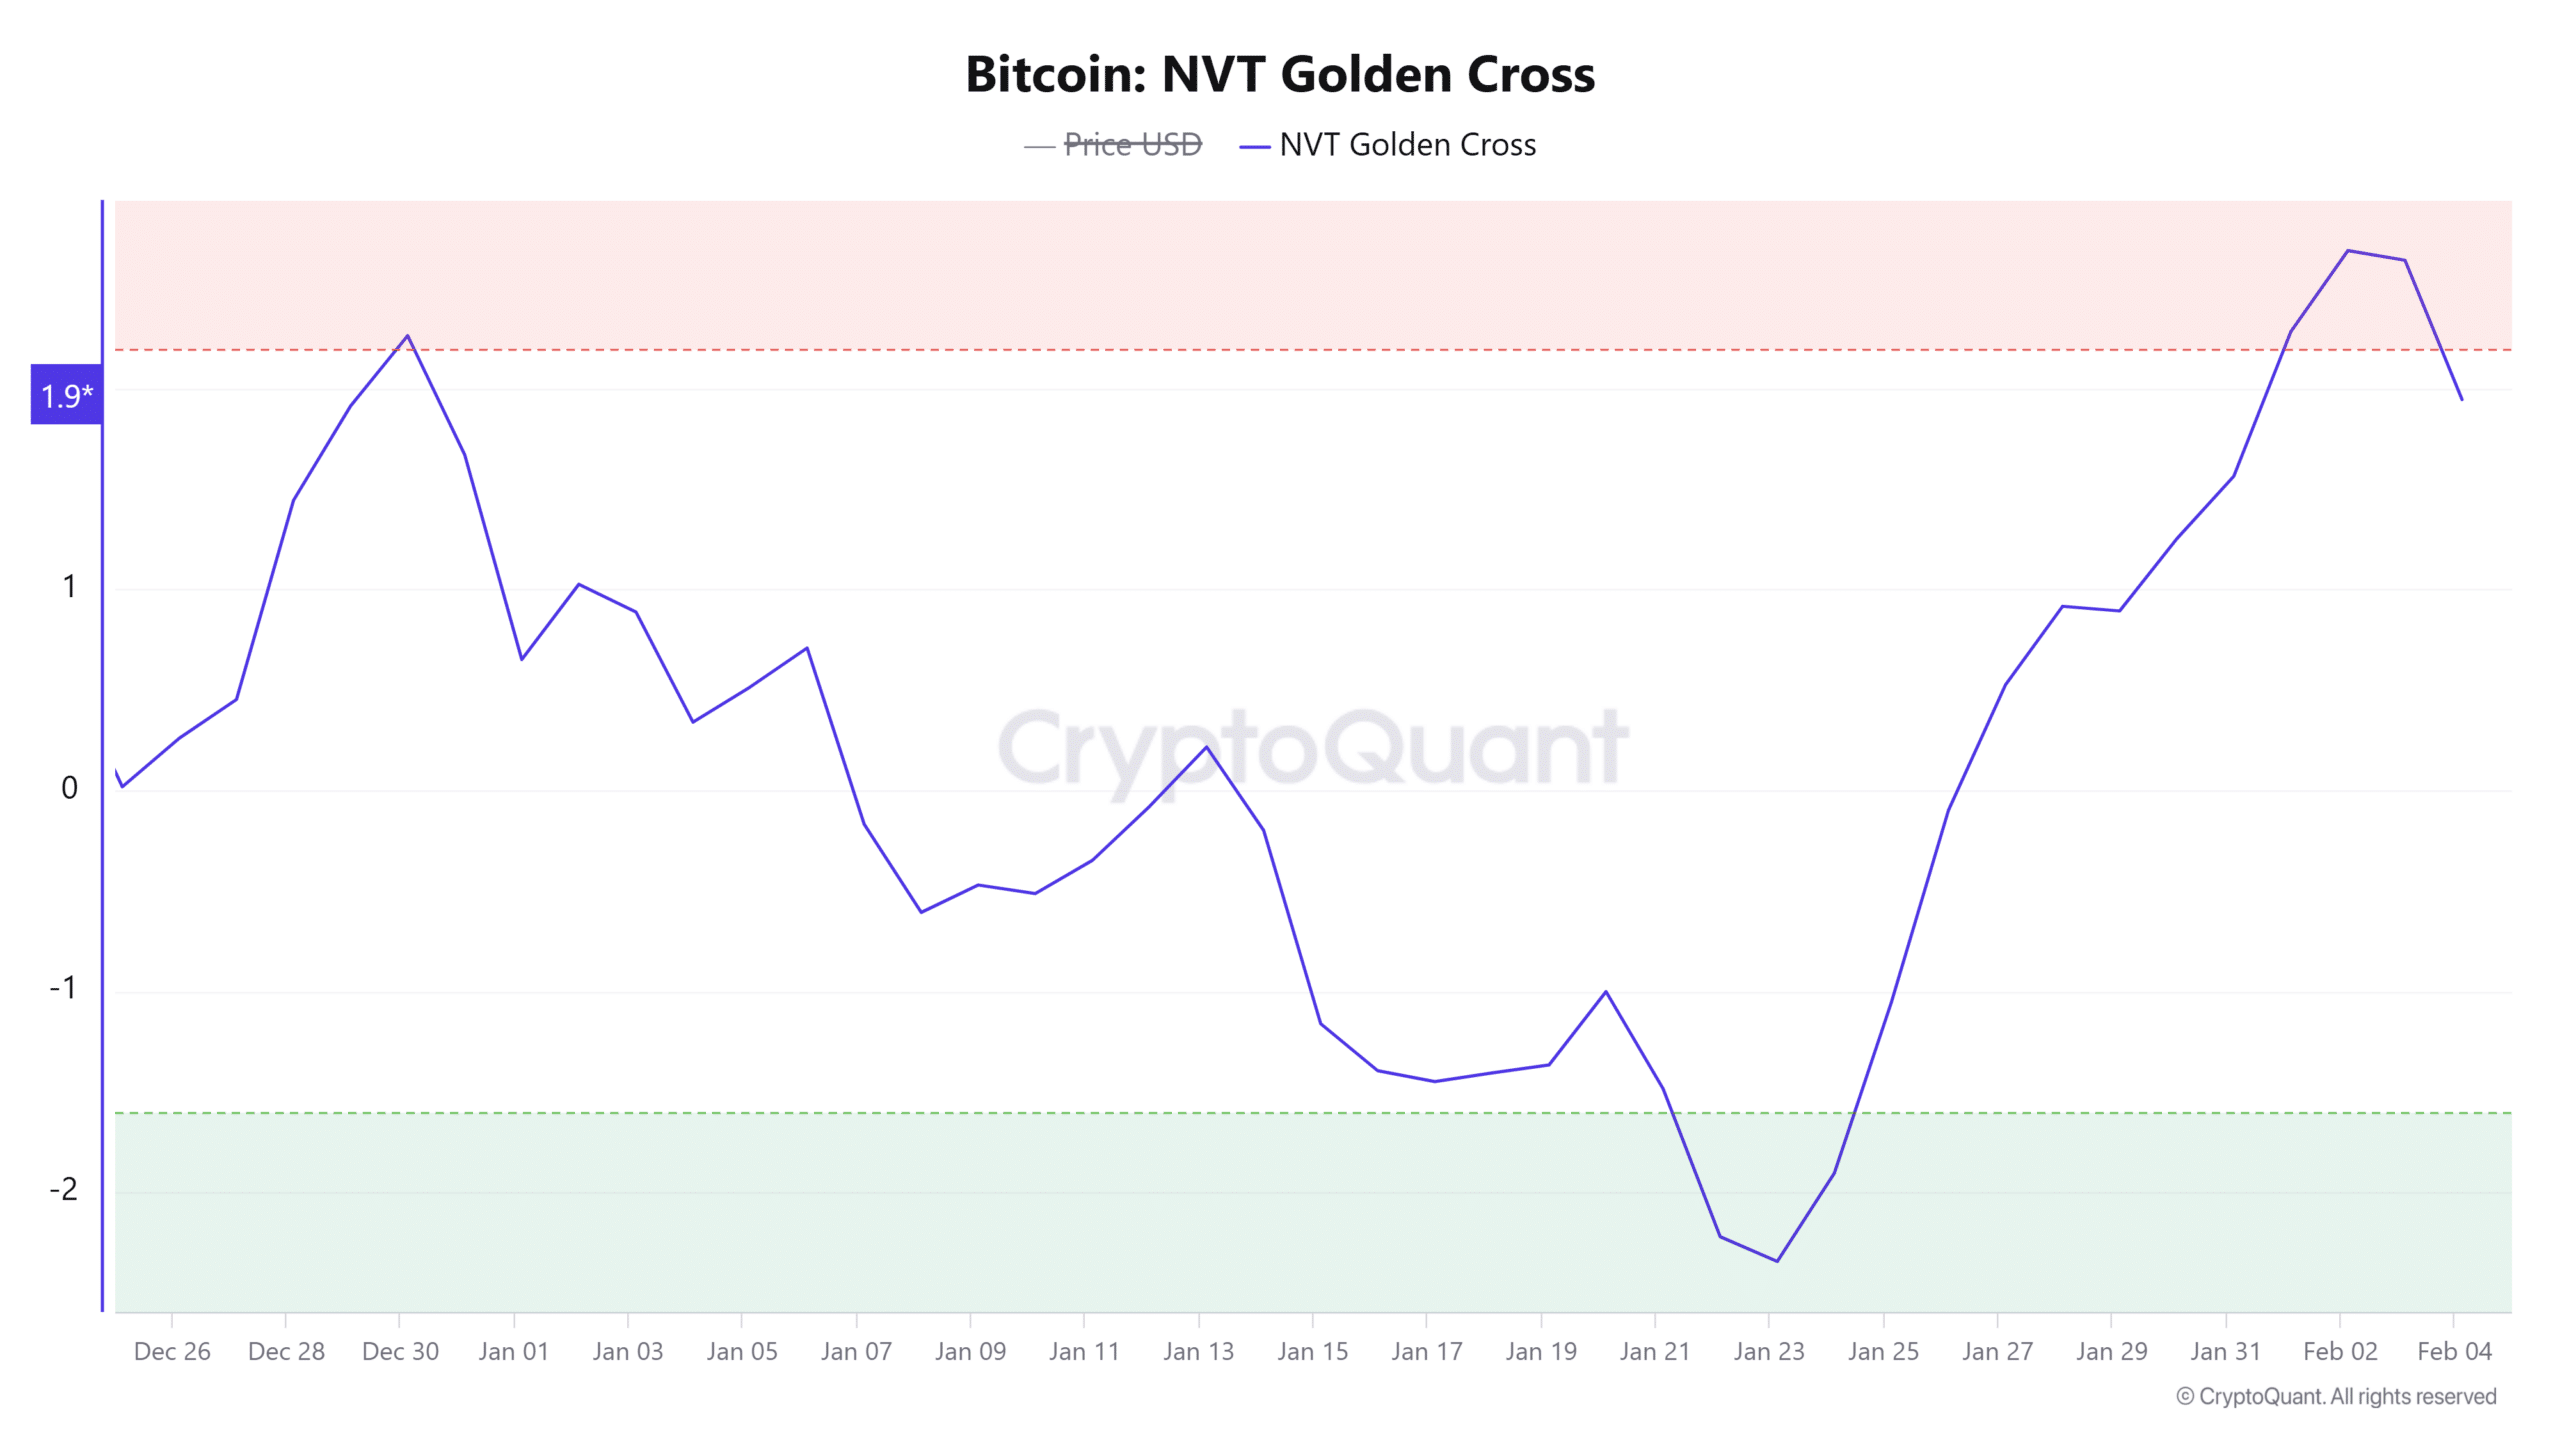

Source: CryptoQuant
Bulls vs. bears: Who has the upper hand?
Market sentiment showed that bulls and bears were in a tight contest. With 111 bulls versus 114 bears in the past week, the market sentiment remains relatively balanced.
Despite some bullish outlooks, bear pressure persisted, signaling that BTC could face resistance as it approaches the $102,350 supply wall.
The outcome of this tug-of-war between the bulls and bears will likely determine whether Bitcoin can break through this resistance and continue climbing.
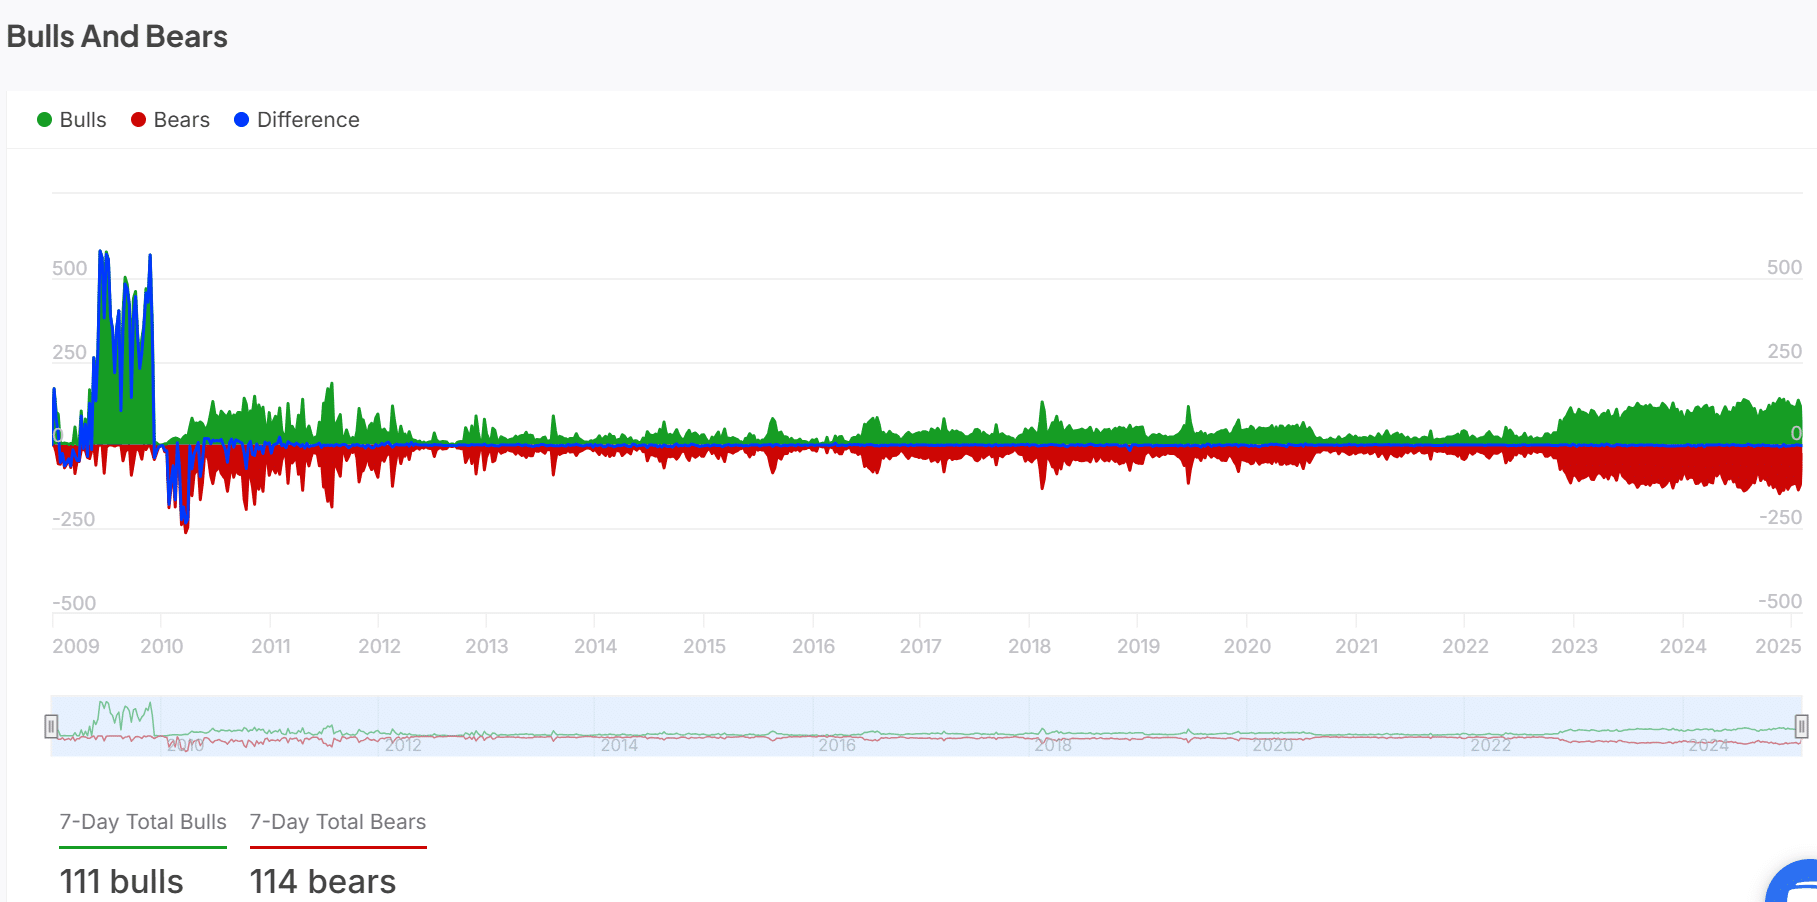

Source: IntoTheBlock
Long vs. short positions: What are traders expecting?
Bitcoin’s Long/Short Ratio revealed that more traders were betting against further price increases. At press time, 45.16% of positions were long, while 54.84% were short.
This suggested that a majority of traders were anticipating a price pullback in the short term.
BTC’s volatility plays a role in this cautious stance, as many traders are uncertain about the sustainability of the recent price movement.
Traders will be watching closely to see if the bullish momentum can overpower the short positions.


Source: Coinglass
BTC can break the $102,350 wall, but…
BTC’s recent recovery, combined with its critical support levels and potential bullish patterns, suggests that the cryptocurrency will likely break through the $102,350–$103,900 supply wall.
While some bearish sentiment remains in the market, the overall technical setup is promising.
Read Bitcoin’s [BTC] Price Prediction 2025–2026
However, the current lack of strong transaction volume and continued resistance from the bears may result in some volatility.
As a result, while Bitcoin is poised to break the supply wall, the journey may involve some fluctuations before a clear breakout.
Source: https://ambcrypto.com/can-bitcoin-break-through-the-102350-supply-wall-assessing/