Key Takeaways
What does the rising stablecoin supply show us?
The ERC-20 stablecoin supply exceeded $250 billion and was nearing $50 billion on Binance alone, showing investors could be readying to enter the market.
Does this mean the market could see a rebound?
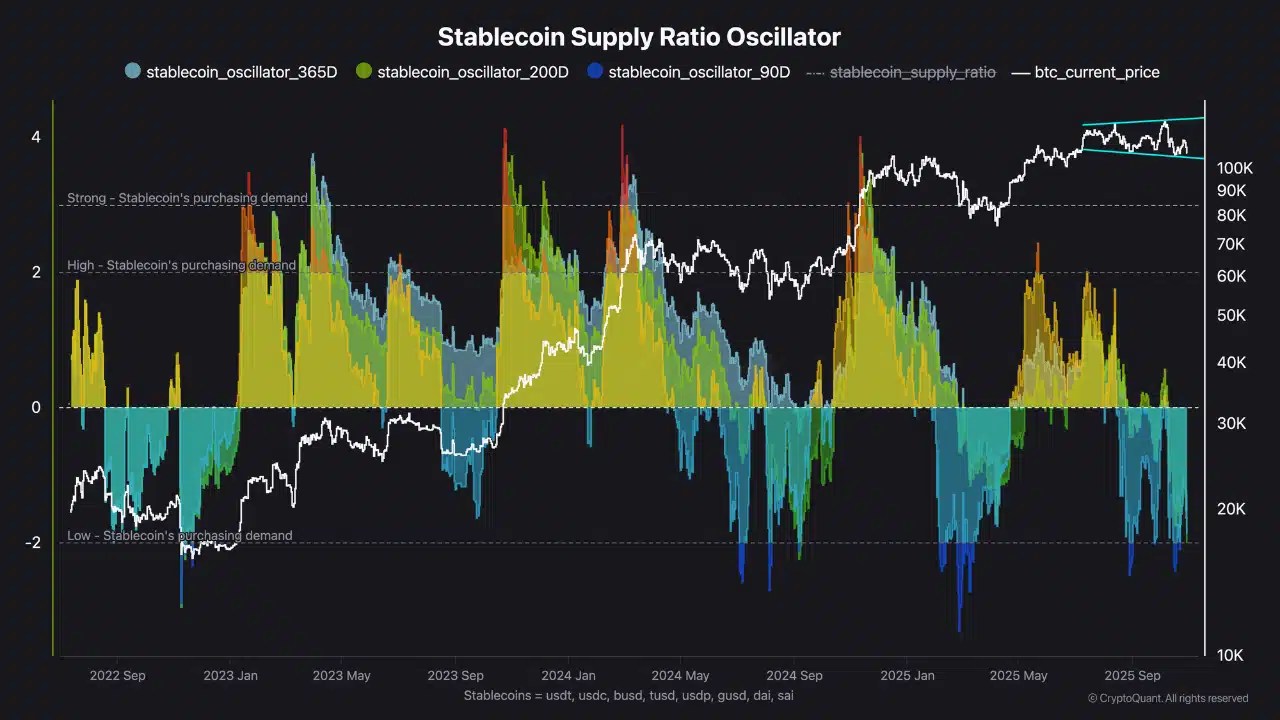
The SSR oscillator answers this more definitively. Its past three years’ trends show that Bitcoin could be forming another bottom and recover thereafter.
Bitcoin [BTC] did not have as bullish an October in 2025 as anticipated at the end of September. Back then, the choppy Bitcoin price action in the $108k-$117k area was expected to be cast aside, and a true “Uptober” to begin.
Global economic uncertainty and a large liquidation event in crypto, the 10/10 crash, “structurally derailed” any momentum that the Uptober narrative built up.
It was the worst October in a decade. Bitcoin was hovering around the $110k area once again at press time.
Are there any signs that show this equilibrium will change?
What could catalyze a Bitcoin momentum shift?


Source: CryptoQuant
In a post on CryptoQuant, analyst Darkfost highlighted that buying power is tied to the availability of liquidity, or stablecoins.
The Total Stablecoin Supply was climbing swiftly and exceeded $250 billion. On Binance alone, the supply of ERC-20 stablecoins was at $48.8 billion.
Despite the shaky, fearful market conditions and price action, the rapidly increasing stablecoin supply suggested investors were preparing to enter the market.
The Stablecoin Supply Ratio (SSR) — Bitcoin’s market cap divided by the stablecoin market cap — supports that view.
THIS signals high buying power

Source: CryptoQuant
The SSR Oscillator has dropped deep into negative territory, showing that stablecoin liquidity outweighs Bitcoin’s current valuation. Historically, such readings have aligned with local market bottoms.
Moreover, these price bottoms were not immediate, but took a while to be established. This could help temper investor expectations based on the past few months’ price action.


Source: CryptoQuant
Binance Stablecoin Netflows saw a five-day streak of positive flows. The highest inflows measured $1.6 billion on the 31st of October.
It was another sign that investors could be positioning themselves to enter the markets.
While the signs pointed to a potential market bottom, it should be remembered that it does not guarantee a market reversal. Neither would such a reversal be immediate, so traders and investors should temper their bullish expectations accordingly.
Source: https://ambcrypto.com/bitcoins-worst-october-in-years-mapping-2-triggers-for-liftoff/