Bitcoin Analysis
Bitcoin’s price finished nearly 1% up for Sunday’s daily session to continue its recent streak dominated by bullish market participants. After the day had ended on Sunday BTC’s price was +$186.8.
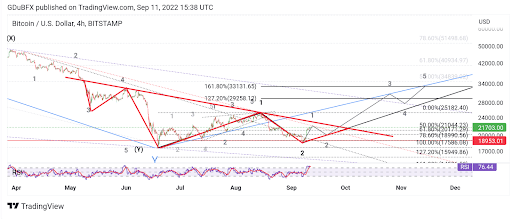
The BTC/USD 4HR chart below by GDuBFX is the first chart we’re providing analysis for to begin another new week. BTC’s price is trading between the 50.00% fibonacci level [$21,044.23] and 0.00% fibonacci level [$25,182.4], at the time of writing.
The overhead target for bullish traders is the 0.00% fib level. That level was where BTC’s price broke down a few weeks ago following a harsh rejection by bearish traders.
Conversely, bearish traders have a primary aim of sending BTC’s price back below the 50.00% fib level with a secondary target of 61.80% [$20,171.29]. If they’re successful at the 61.80% fib the next targets to the downside for bears are 78.60% [$18,990.56], 100.00% [$17,586.08], and 127.20% [$15,949.86].
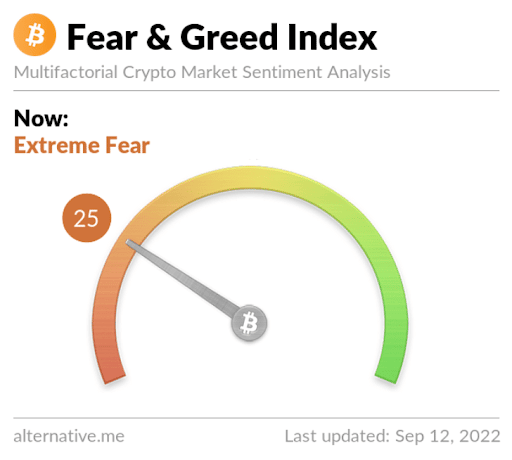
The Fear and Greed Index is 25 Extreme Fear and is -1 from Sunday’s reading of 26 Fear.

Bitcoin’s Moving Averages: 5-Day [$19,757.9], 20-Day [$21,096.45], 50-Day [$21,786.21], 100-Day [$25,331.9], 200-Day [$34,132.31], Year to Date [$32,519.98].
BTC’s 24 hour price range is $21,350-$21,860 and its 7 day price range is $18,650-$21,860. Bitcoin’s 52 week price range is $17,611-$69,044.
The price of Bitcoin on this date last year was $46,060.3.
The average price of BTC for the last 30 days is $21,411.4 and its -6.6% over the same duration.
Bitcoin’s price [+0.86%] closed its daily candle worth $21,836.9 and in green figures for the fifth consecutive day.
Ethereum Analysis
Ether’s price was the outlier for today’s project analyses because bearish traders won Sunday’s battle. ETH’s price finished Sunday’s daily candle -$7.36.
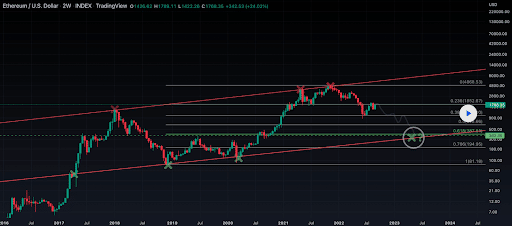
The second chart we’re looking at today is the ETH/USD 2W chart below by Meridians. ETH’s price is trading between the 0.382 fib level [$1,019.1] and 0.236 [$1,852.67], at the time of writing.
ETH’s price has recovered nicely after recently testing the 0.382 fib level but bullish Ether market participants have been unable to regain the 0.236 fib level for an extended period.
The targets on the 2W chart to the downside for those going short on ETH are 0.382, 0.5 [$628.66], 0.618 [$387.81], 0.786 [$194.95], and the 1 fib level [$81.18].
Ether’s Moving Averages: 5-Day [$1,637.49], 20-Day [$1,669.75], 50-Day [$1,560.89], 100-Day [$1,718.92], 200-Day [$2,451.68], Year to Date [$2,279.74].
ETH’s 24 hour price range is $1,720.1-$1,789 and its 7 day price range is $1,502.29-$1,789. Ether’s 52 week price range is $883.62-$4,878.
The price of ETH on this date in 2021 was $3,407.9.
The average price of ETH for the last 30 days is $1,684.07 and its +4.15% over the same period.
Ether’s price [-0.41%] closed its daily session on Sunday worth $1,766.99 and in red digits breaking up a streak of four consecutive days in positive figures prior to Sunday’s candle close.
Quant Analysis
Quant’s price was also sent higher again on Sunday and when traders settled-up at its session’s close, QNT’s price was +$3.4.
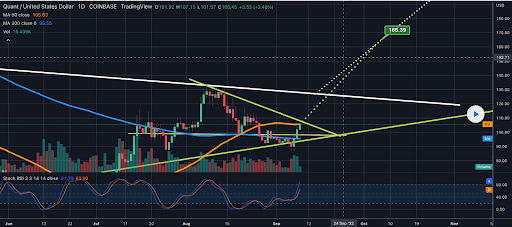
The third chart we’re analyzing today is the QNT/USD 1D chart below from DrDovetail. Bullish Quant traders are attempting to keep Quant’s price above the 50D MA [in orange].
At the same time, QNT’s price is also trying to break out of a symmetrical triangle pattern.
The overhead target for bullish traders is the $127 level which was the peak of QNT’s most recent local high.
Bearish traders are obviously hoping the $127 level isn’t seen again and that they can send QNT’s price back down to retest support and the current trend line on the daily timescale at the $95 level.
Quant’s price is +121.5 against The U.S. Dollar for the last 12 months, +129.4% against BTC, and +51.99% against ETH, over the same period.
Quant’s 24 hour price range is $102.2-$109.8 and its 7 day price range is $87.46-$109.8. QNT’s 52 week price range is $40.7-$417.49.
Quant’s price on this date last year was $360.69.
The average price of QNT over the last 30 days is $105.23 and its -14.55% over the same duration.
Quant’s price [+3.23%] closed its daily candle worth $108.7 on Sunday and QNT’s finished in green figures for five straight days.
Source: https://en.cryptonomist.ch/2022/09/12/bitcoins-price-straight-green-daily-candle/


