![]()
![]()
Journalist
Posted:
Key Takeaways
How did Bitcoin react to the U.S. Federal Reserve rate cut news?
Bitcoin briefly fell to $114.7k, a 1.77% drop for the day, but bounced to $116.5k by the close on the 17th of September.
Should traders expect BTC to trend higher now?
Volatility is expected to persist until the $117.5k local resistance is broken; thereafter, an uptrend would become more likely.
Bitcoin [BTC] was just 5.6% below its all-time high at $124k. Bitcoin bulls were challenging the $117.5k local resistance.
The FOMC meeting brought heightened short-term price volatility, but BTC is likely to be a beneficiary of the rate cut in the coming months.

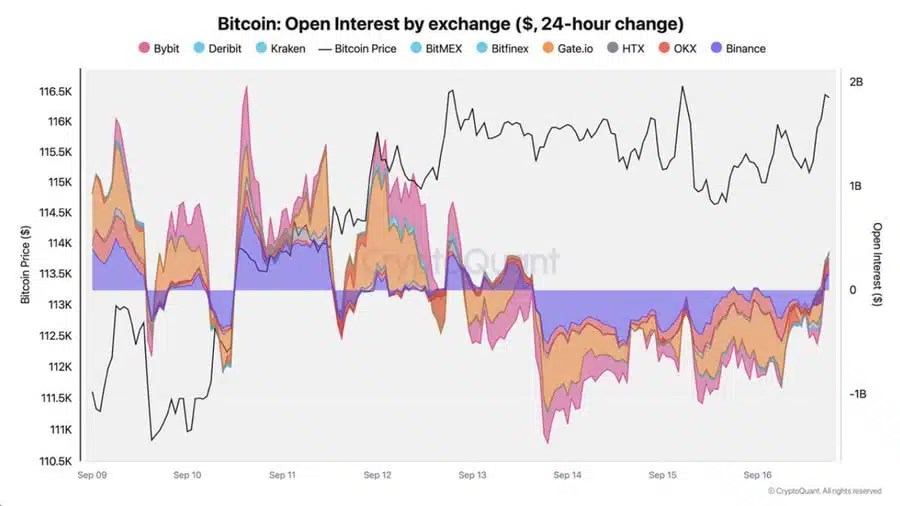
Source: CryptoQuant
To examine what traders can expect in the coming days, AMBCrypto examined the derivatives market and exchange netflow metrics.
In a post on CryptoQuant Insights, XWIN Research Japan noted that the 24-hour change in Bitcoin futures flipped positive for the first time in three days.
The boost in Open Interest showed that market participants were confident of a sustained move to the upside.
Whether such a move will come soon, or if this will serve as liquidity for the price to sweep up before a bearish reversal, was unclear.
If Bitcoin can not climb convincingly past the $117.5k level, it could be a signal that the price is hunting liquidity before the next trend.
Accumulation and some profit-taking


Source: CryptoQuant
The Spent Output Age Bands showed that there was no flurry of BTC movement from short-term holders (155 days or less).
The age bands saw noteworthy spikes on the 16th and 21st of July, and then again on the 29th of August.
This showcased increased STH wallet activity and was a warning of selling pressure. On the 29th of August, Bitcoin fell to $108.4k, and the metric reflected panic in the market.
At the time of writing, as BTC moved to challenge the $117.5k resistance, some short-term holders were moving their tokens and possibly selling, but it was not as strong as the aforementioned dates.


Source: CryptoQuant
The exchange netflow metric revealed that there were severe outflows on the 29th of August, which meant that the price dip below $110k was scooped up by market participants.
Similarly, there were sizeable netflows of -13,262 Bitcoin on the 15th of September as well. The negative value denoted outflows and signaled accumulation.
Therefore, the rising OI and the exchange netflows both showed holders were confident of a resurgent Bitcoin.
Traders should not dive into long positions immediately, but should be aware that the sentiment was bullish and volatility was possible.
Source: https://ambcrypto.com/bitcoins-post-fed-path-breakout-ahead-or-liquidity-trap/