- Bitcoin’s sharp decline to $88,000 ignited market-wide speculation among traders.
- Short-term holders exhibited panic-driven behavior during BTC’s decline.
Bitcoin’s[BTC] sharp decline to $88,000 ignited market-wide speculation among traders. Key metrics analysis has brought out mixed feelings in their current movement.
Understanding these trends offers insight into whether Bitcoin has reached a local bottom or if further downside risks persist.
Bitcoin: Is this a sign of market recovery?
Analysis of the Global Bid & Ask Indicator, which is data aggregating from over 1,400 cryptocurrencies, provided a clear view of spot market sentiment.
Recent shifts in the Global Bid-Ask Ratio signaled a potential market bottom, which has historically preceded bullish price reversals.

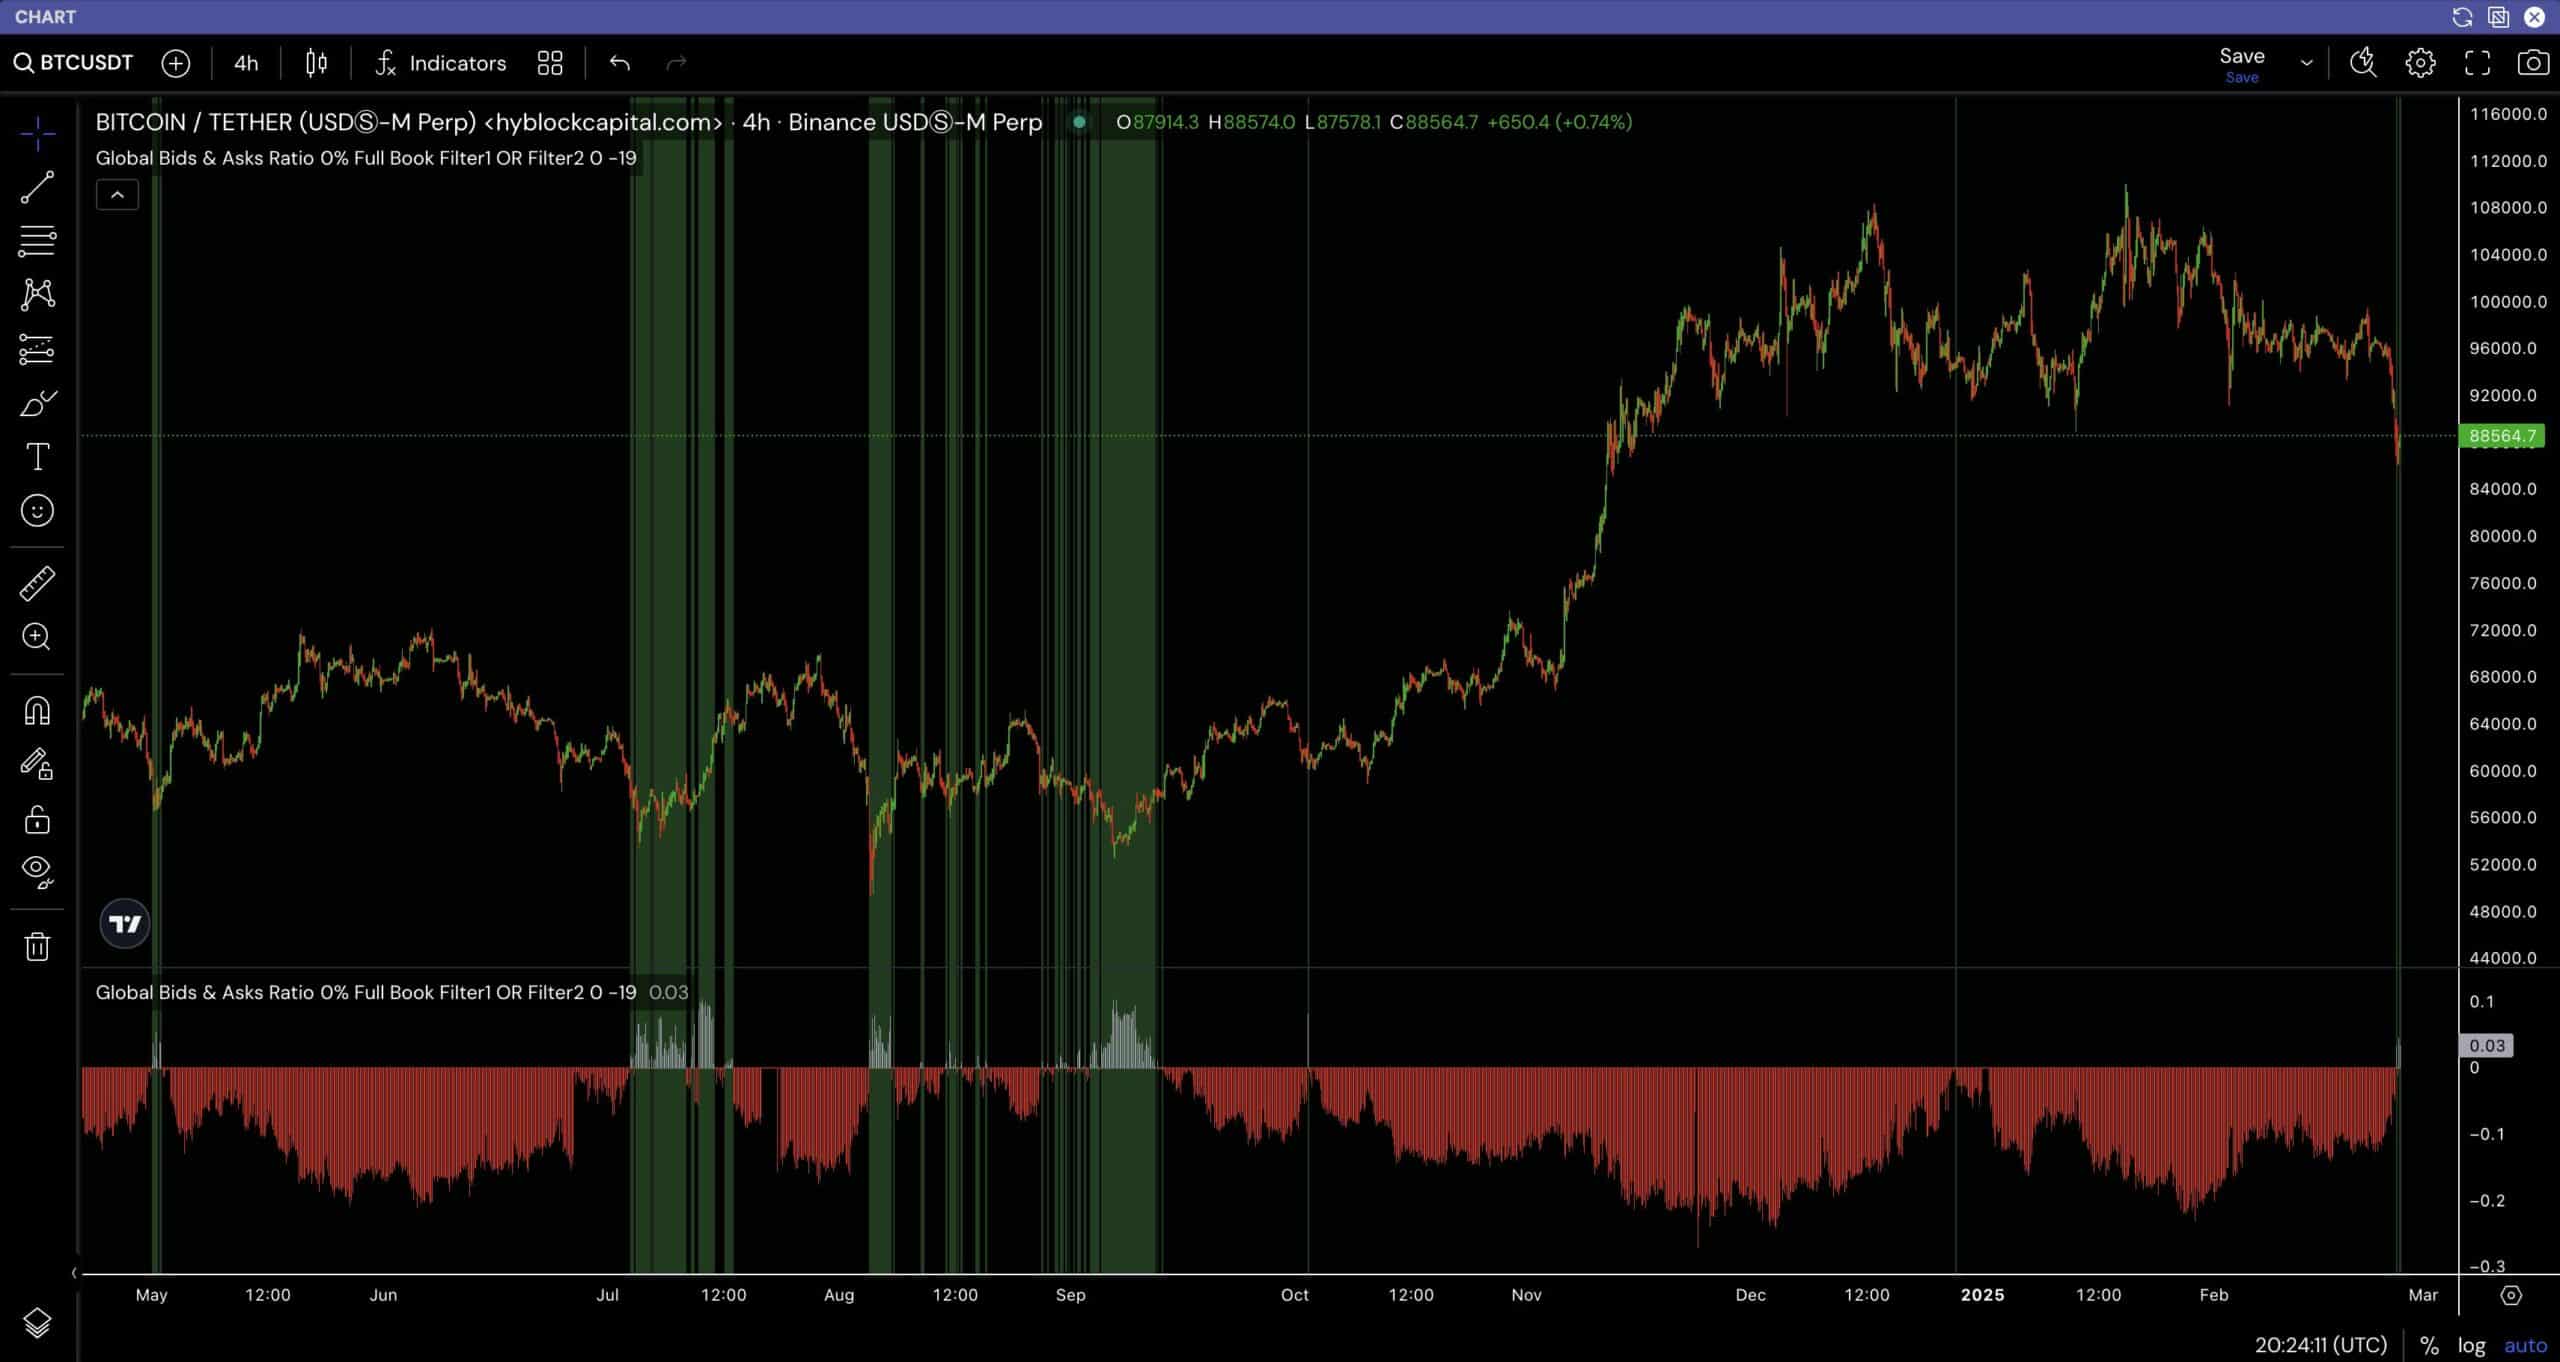
Source: Hyblock.com
Additionally, the histogram indicated a spike in buying pressure, contrasting the previous bearish trend from May 2024 to October 2024.
This reversal suggested that Bitcoin might have reached a key support level, drawing increased demand.
Analysis showed this metric as a strong, manipulation-resistant gauge of true supply and demand. It hints at a possible recovery from recent losses.
Panic selling intensifies market volatility
Further, Short-term holders exhibited panic-driven behavior during BTC’s decline. The Short-Term Holder SOPR chart showed a steep drop below one, confirming widespread selling at a loss.
This suggested that investors who acquired Bitcoin at higher levels liquidated their holdings, fearing further declines.

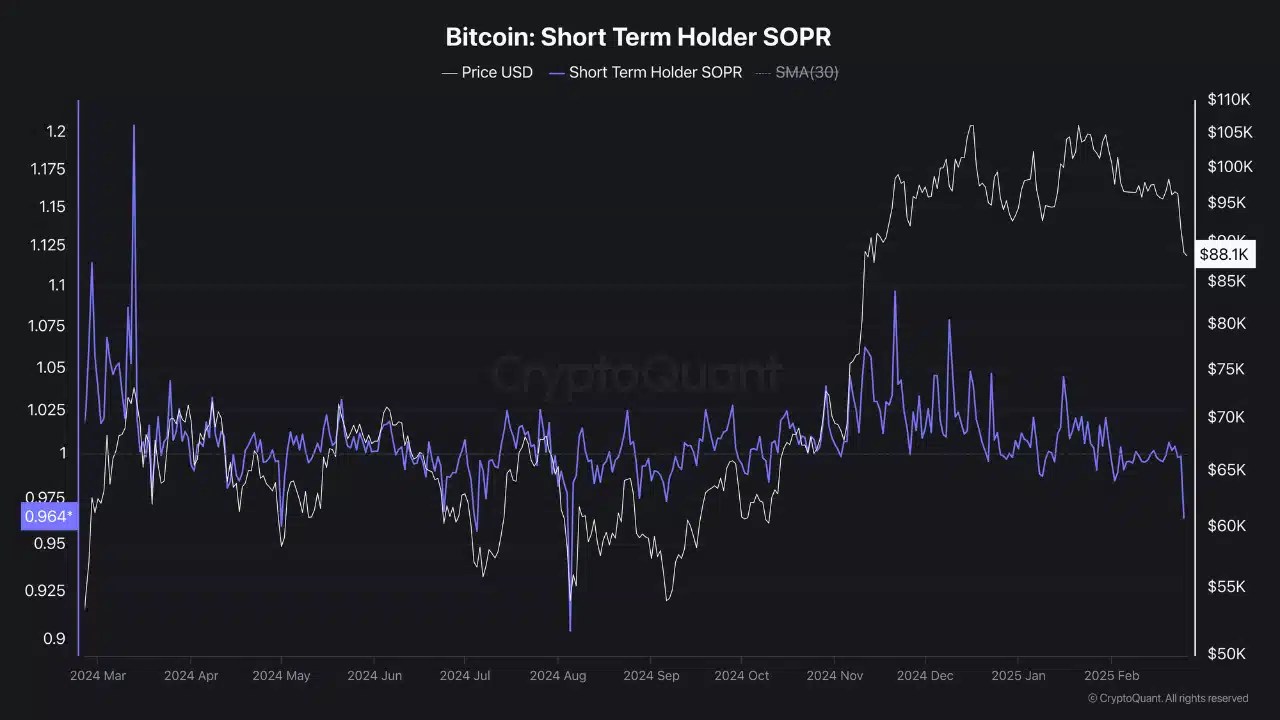
Source: CryptoQuant
Bitcoin’s price drop to $88,000 intensified this reaction, aligning with previous sell-offs triggered by major price corrections. If Bitcoin experiences further downside, additional panic selling could emerge, exacerbating volatility.
However, experienced traders saw this as a potential accumulation zone, capitalizing on market fear to establish long-term positions.
Long-term holders’ moves suggest…
Deep analysis shows that while short-term holders sold in panic, long-term investors remained resilient.
The Long-Term Holder SOPR chart reflected minimal selling pressure, suggesting strong conviction among holders with a 155-day+ investment horizon.


Source: CryptoQuant
These investors, who acquired Bitcoin for around $60,000 in September 2024, chose to hold through the downturn, reinforcing market stability. Their lack of reaction to short-term fluctuations suggested that Bitcoin’s long-term fundamentals remained intact.
Normally, such behavior precedes recoveries, as long-term holder confidence serves as a foundation for future price rebounds.
Bitcoin’s liquidation landscape: Risk and opportunity
Finally, BTC’s high leverage levels fueled volatility, leading to massive long position liquidations, particularly on Bybit. The Aggregated Liquidation Levels Heatmap revealed that Bitcoin’s decline to $88,000 triggered significant forced sell-offs.

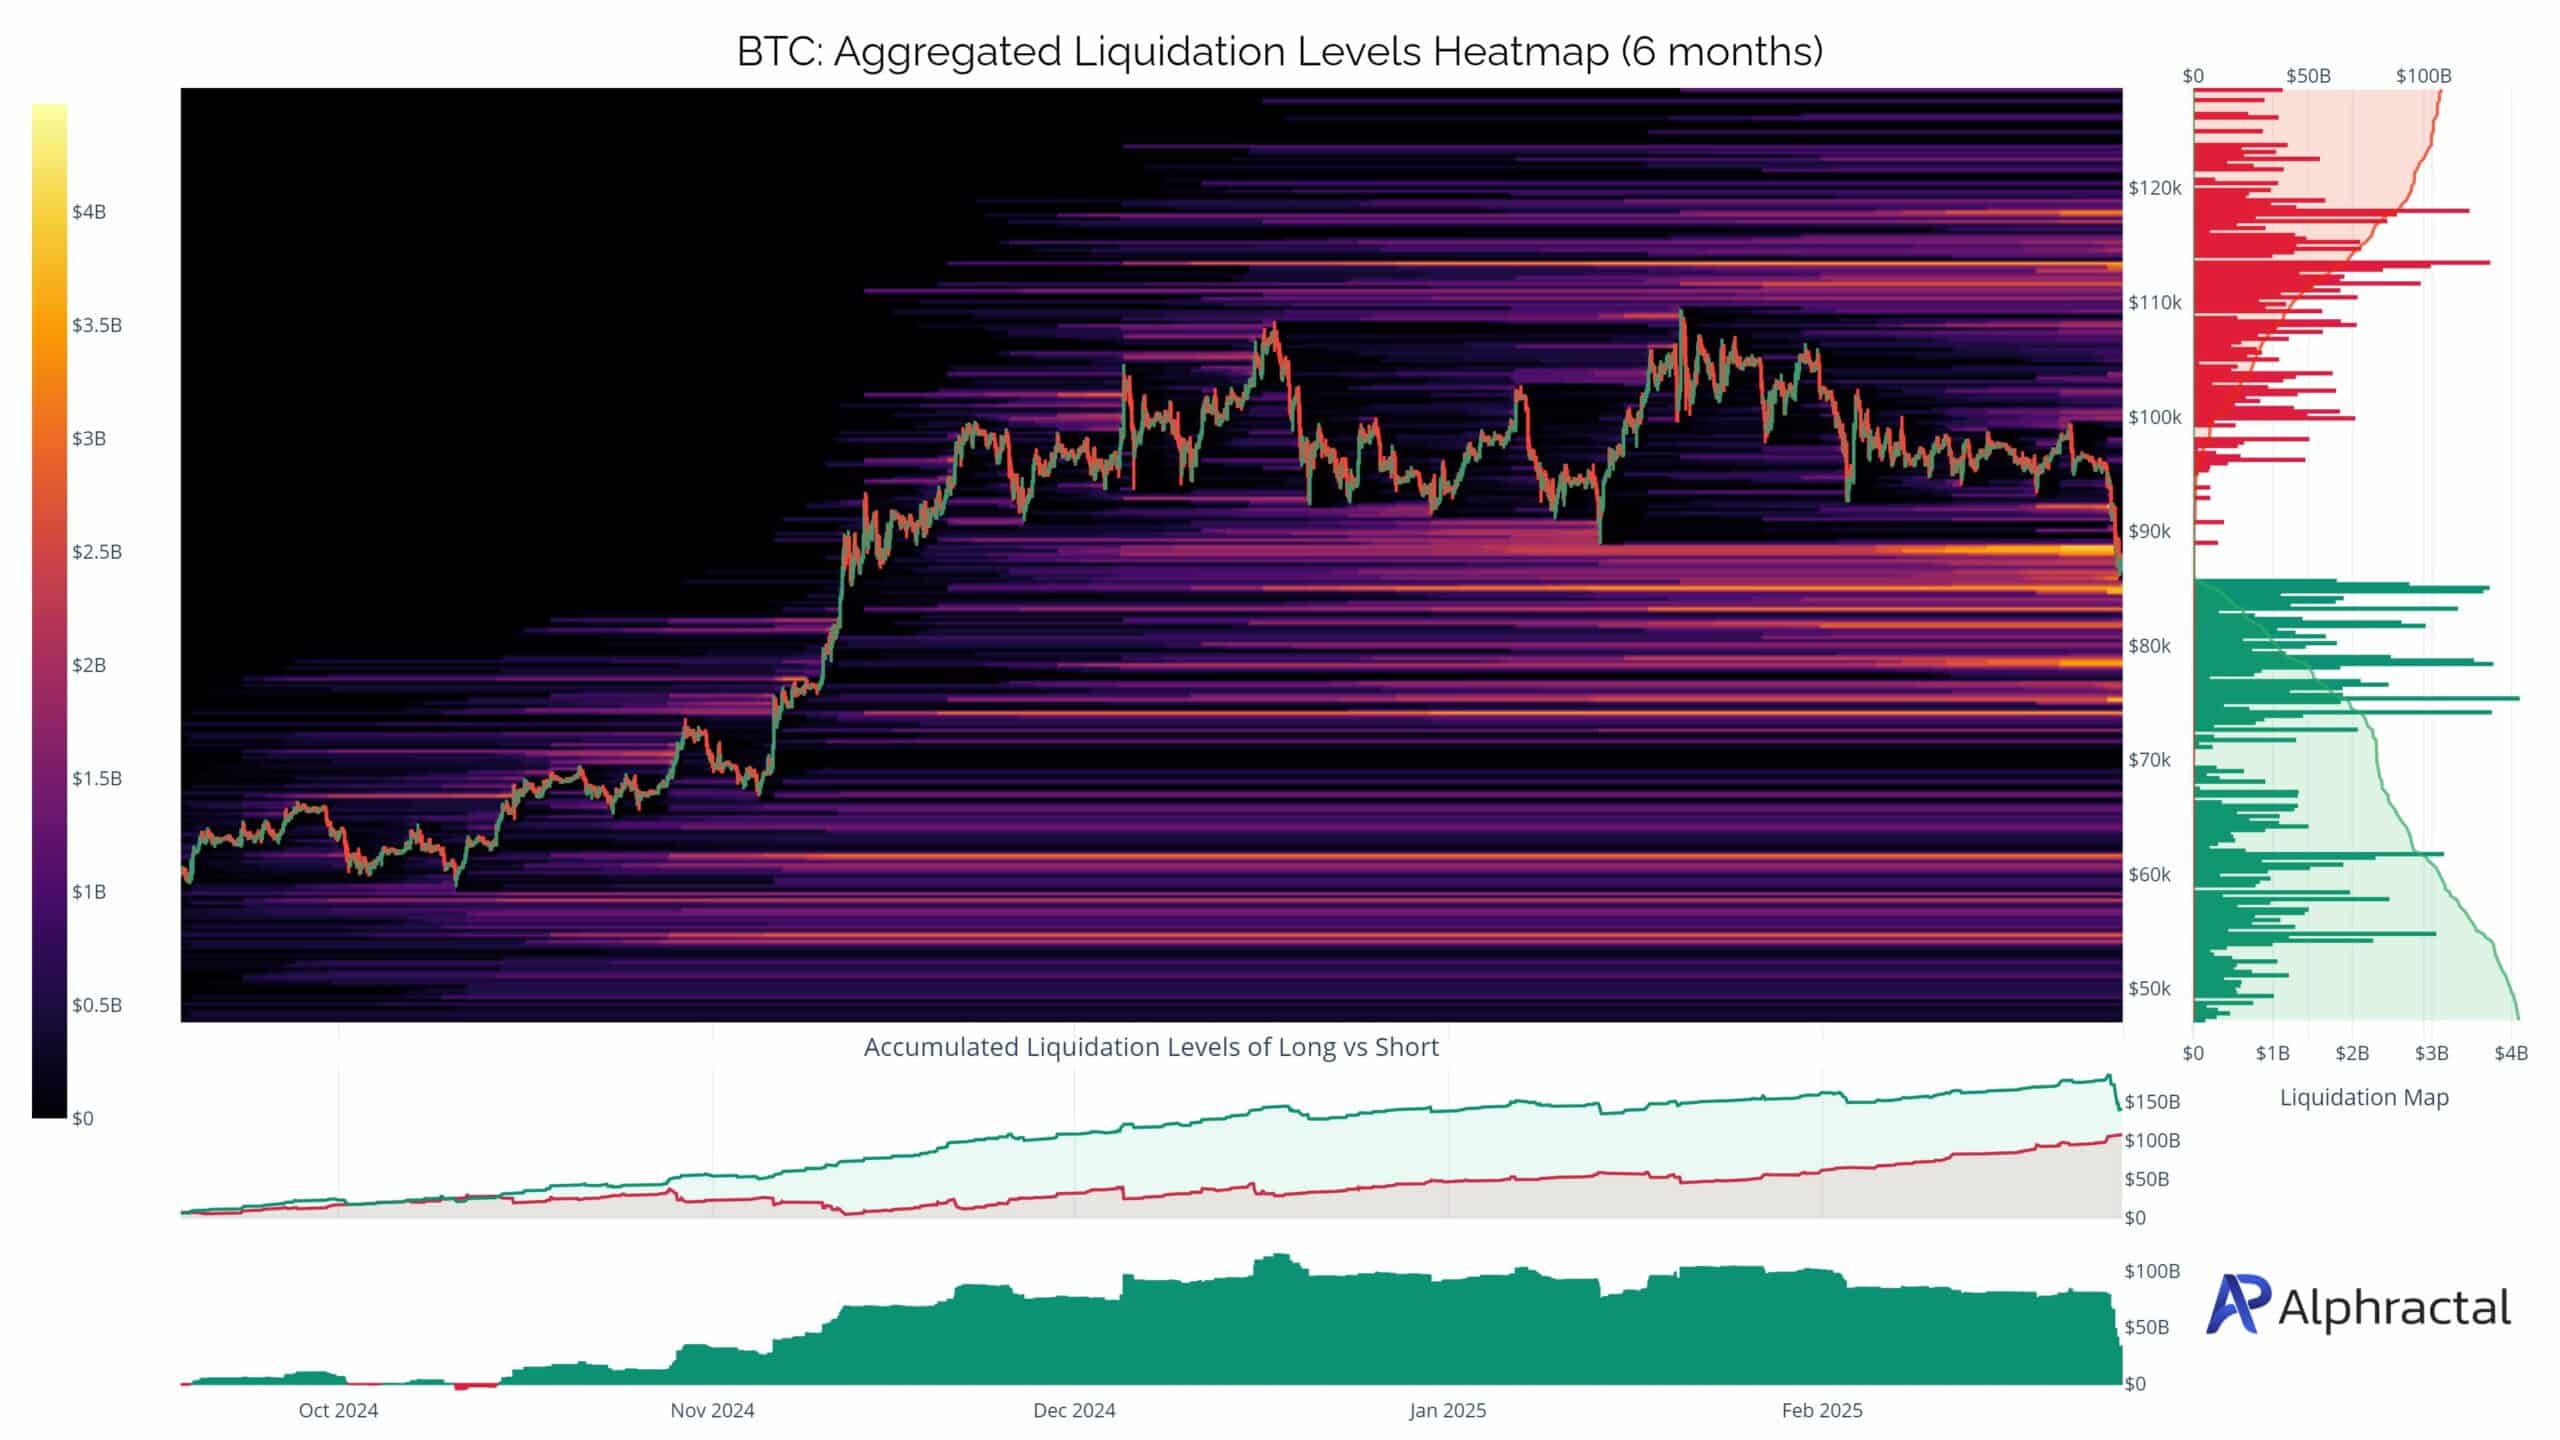
Source: Alphacratal
The heatmap highlighted a major short position liquidation zone above $113,000. This suggested that if Bitcoin reversed momentum, it could target this level, driven by forced short liquidations.
Traders recognized this setup as a double-edged signal, presenting downside risks but also a potential short squeeze if Bitcoin’s price stabilizes and rebounds.
In conclusion, Bitcoin’s drop to $88,000 reflected a complex mix of market forces. The Global Bid & Ask shift suggested a potential bottom, while short-term holders’ panic selling and long-term holders’ stability provided a contrast in market sentiment.
Source: https://ambcrypto.com/bitcoin-fall-triggers-panic-but-this-indicator-hints-at-a-recovery-how/