- Bitcoin’s exchanges reserves saw an upswing with +20k BTC inflows
- Bitcoin’s netflow turned positive after weeks of decline
Since hitting an all-time high of $108k on the charts, Bitcoin [BTC] has struggled to maintain any momentum on the charts. In fact, the crypto has traded sideways over the past 2 weeks. At the time of writing, Bitcoin was trading at $94,480 following losses of 2.01% over a 24-hour timeframe.
Needless to say, the prevailing market conditions have left analysts talking about BTC’s price trajectory, with some of them even anticipating a potential crash.
IT Tech, a popular Cryptoquant analyst, is one of them, with the aforementioned predicting a potential market correction in lieu of rising reserves and netflows.
Bitcoin’s reserves and exchange netflows soar
According to Cryptoquant, Bitcoin metrics have been flashing signs of a potential change in market dynamics.
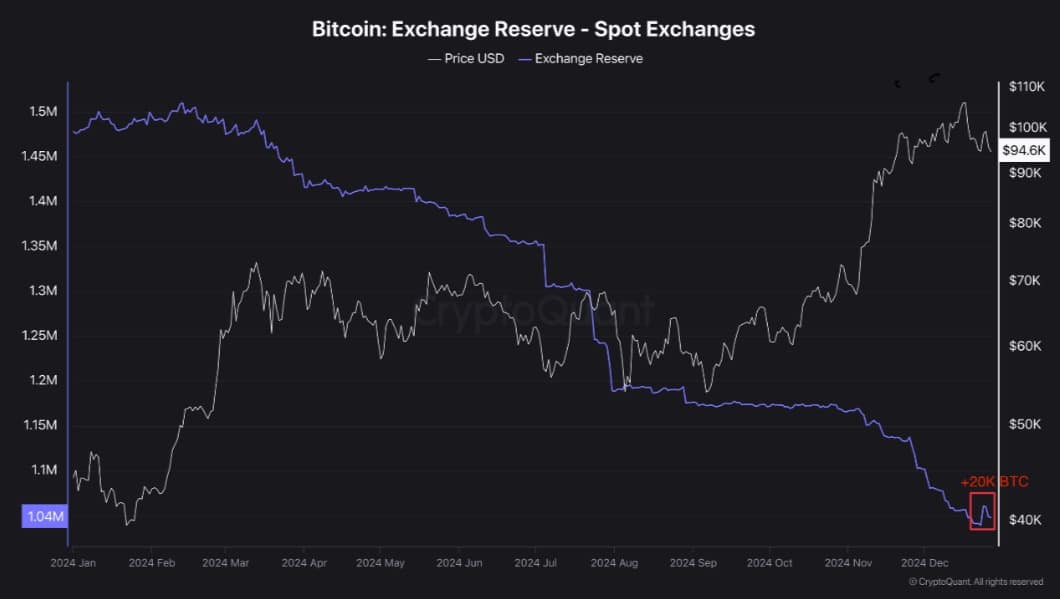
For example – BTC’s spot exchange reserves, after declining consistently over the past month in light of investors getting their assets off exchanges, recently recorded a significant uptick with 20k BTC inflows.


Source: Cryptoquant
When spot reserves record a sustained hike, it indicates that more Bitcoin has been moving into exchanges.
This usually signals an intent to trade or sell, introducing potential selling pressure. Therefore, this could be one of the early indicators of short-term market volatility or correction.


Source: Cryptoquant
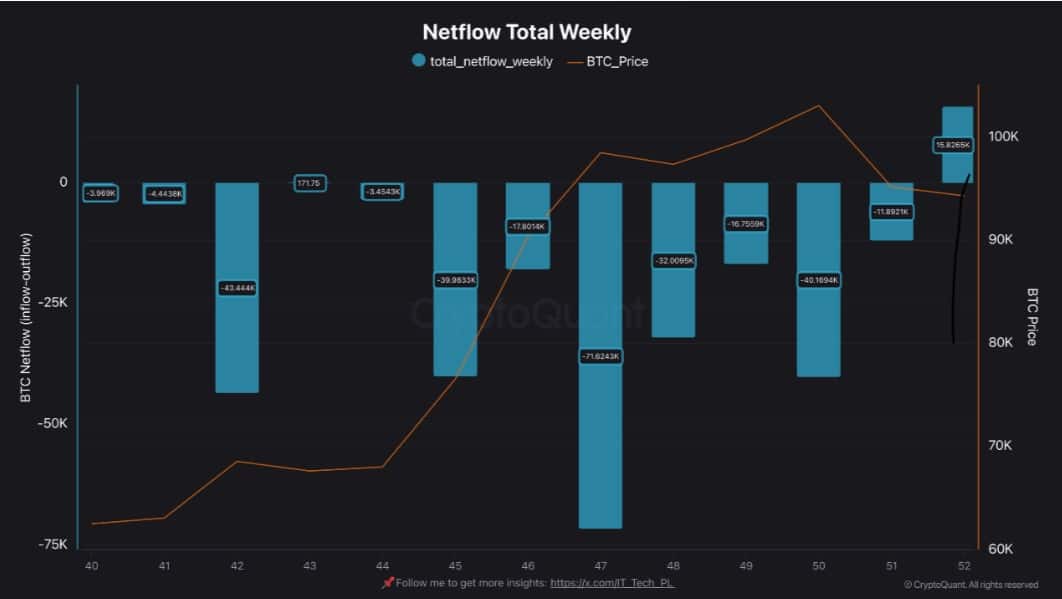
Additionally, netflows across all exchanges turned positive with +15.8k BTC reversing its previous negative trend. When netflows turn positive, it indicates that inflows to exchanges are outpacing outflows.
When positive netflows combine with a rising reserve, it alludes to the strengthening of the chances of profit-taking behavior by Bitcoin investors.
These market changes may reflect signs of growing caution or a shift in market sentiment. Simply put, investors are likely preparing for profit-taking or anticipating a price correction.
Therefore, if these two metrics continue to rise, we could see greater volatility and potential downward pressure on BTC’s price, especially in the near term.
Impact on BTC Charts?
Usually, when inflows to exchanges rise, it underlines investors’ lack of market confidence and signals strong bearish sentiment.


Source: IntoTheBlock
This bearishness is not only prevalent among retail traders,
but also large holders. According to IntoTheBlock, large holders’ netflow to exchange netflow ratio surged over the past week from -0.04 % to 0.27%. Such a spike revealed that whales have been sending assets into exchanges – A trend which usually precedes selling, leading to potential downward pressure on the price.


Source: Santiment
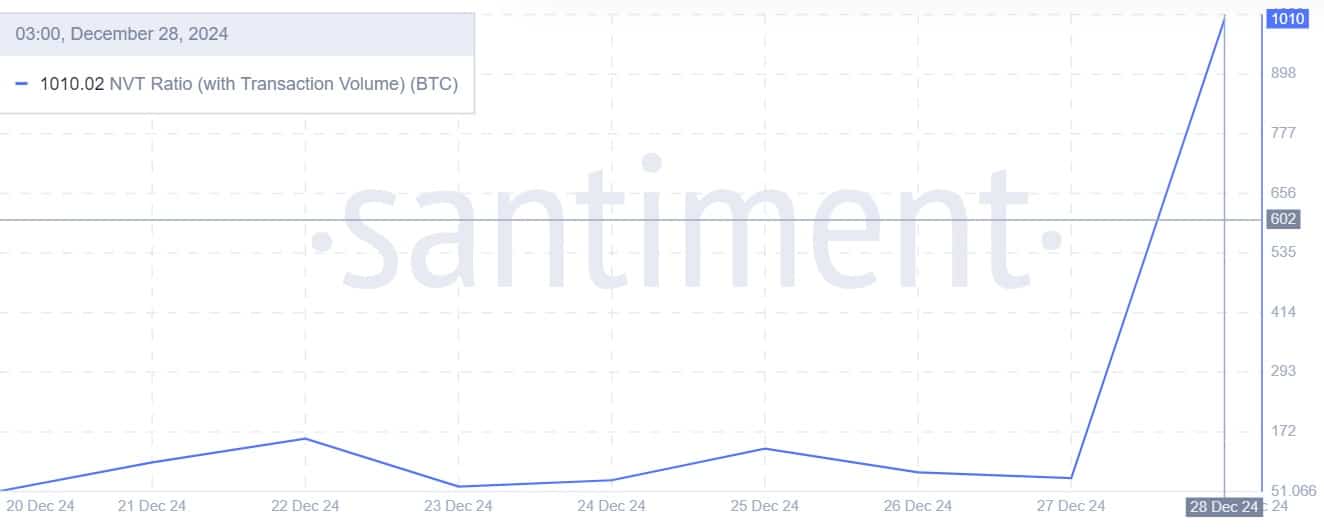
Finally, the NVT ratio (with transaction volume) registered a massive upswing to hit 1010.02. This indicated that BTC’s market cap is exceptionally high, compared to the daily transaction volume.
Historically, NVT ratio spikes to extreme levels such as the ones seen over the past week have often preceded price corrections as markets tend to realign with underlying fundamentals.
Simply put, the current market conditions point towards a potential market correction. If the prevailing investors’ sentiment persists, BTC could see some losses on its price charts.
We could see Bitcoin drop to $92,700. If BTC fails to hold this support, the price can crash to $86,000.
Source: https://ambcrypto.com/bitcoins-exchange-reserve-rises-as-netflows-turn-positive-impact-on-btc/