- BTC NVT value fell below -2.4, placing Bitcoin in a deeply oversold zone.
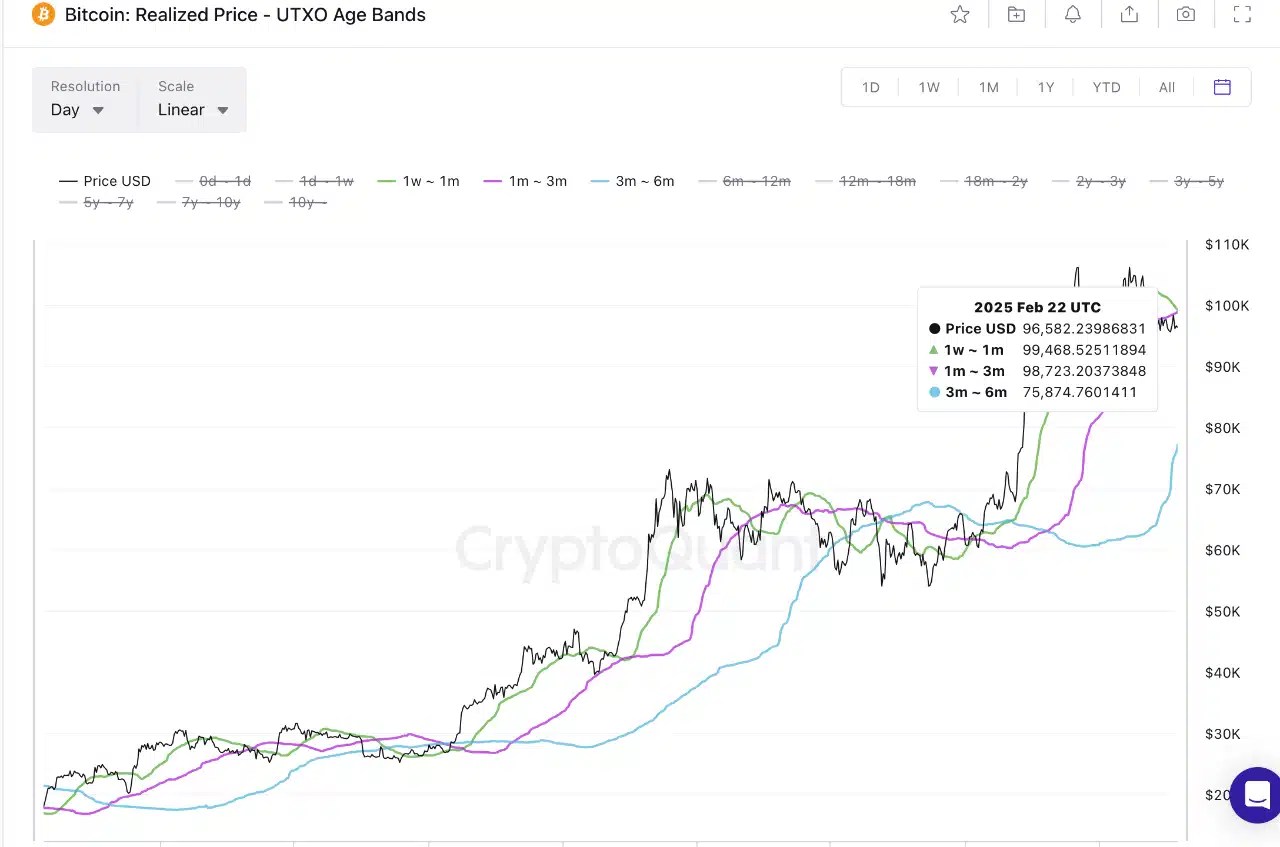
- The UTXO Realized Price Age Distribution indicated realized prices across age bands revealed investor holding patterns.
Bitcoin’s[BTC] market landscape presented traders with a mix of uncertainty and opportunity. As volatility persisted, key patterns emerged, signaling potential turning points in price action.
Historical trends hinted at critical support and resistance levels that could shape Bitcoin’s next move.
By analyzing past cycles and current market conditions, investors aimed to distinguish between short-term fluctuations and long-term trends, positioning themselves for the next phase of Bitcoin’s evolution.
Moreover, CryptoQuant’s NVT Golden Cross chart highlighted Bitcoin’s market conditions. The NVT Golden Cross effectively identified local peaks and troughs.
An NVT value above 2.2 signaled overbought conditions and potential tops, while a value below -1.6 indicated oversold conditions and possible bottoms.


Source: CryptoQuant
Recently, the NVT value fell below -2.4, placing Bitcoin in a deeply oversold zone. This suggests Bitcoin has reached a local bottom. If a rebound occurs, the 111-day Moving Average at $96,895 will act as resistance.
Further analysis showed two similar oversold patterns in 2023 and 2024, each preceding price recoveries. These historical parallels indicate a potential upward movement from this oversold state.
Thus, there is a possibility of the NVT Golden Cross rebounding, leading to a shift in the current market trend.
Bitcoin investor behavior and its impact on price stability
Further analysis into the UTXO Realized Price Age Distribution indicated realized prices across age bands revealed investor holding patterns.

Source: CryptoQuant
The 1-3 month and 3-6 month ranges tracked recent buyer behavior. In bull markets, fear often drove smaller investors to sell, creating support at these levels.
However, in early 2025, the 1-3 month realized price dropped below typical support zones. A potential support emerged between the 3-6 month range, around $75,875. This shift suggested Bitcoin faced downward pressure but found a floor near this level.
The pattern resembled mid-2022 corrections, where similar support zones stabilized prices, hinting at a potential recovery if buying resumed.
Long-Term market trends and potential growth signals
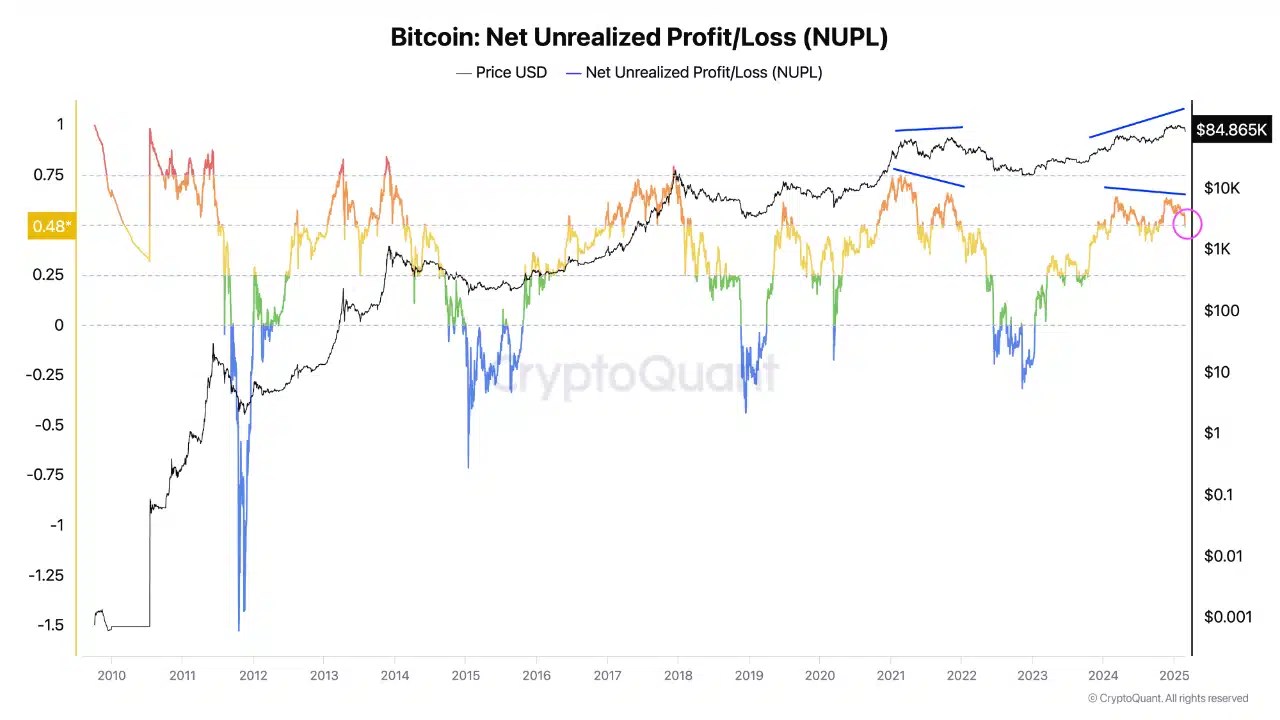
Bitcoin’s Net Unrealized Profit/Loss (NUPL) metric offered a long-term perspective on market sentiment. NUPL measured the difference between unrealized profits and losses, signaling profit or loss states.

Source: CryptoQuant
In February 2025, NUPL remained below the 0.50 support level at 0.48. A monthly close above 0.50 in February would support a potential price increase.
This level indicated investors held losses, creating conditions for a rebound. The pattern mirrored late 2023 when NUPL below 0.50 preceded a significant rally.
Traders viewed this as a strategic re-entry point, anticipating upward momentum if sentiment improved.
Strategic insights
Bitcoin’s metrics in February 2025 painted a cautious yet opportunistic picture. The NVT Golden Cross’s oversold reading below -2.4 signaled a local bottom, with resistance at $96,895 if prices rebounded. The UTXO Realized Price Age Distribution identified $75,875 as a key support, mirroring past correction patterns.
NUPL’s position below 0.50 suggested unrealized losses, but a break above this level forecasted potential growth, similar to 2023 trends. Together, these indicators pointed to a possible price recovery, contingent on market sentiment and buying activity.
Source: https://ambcrypto.com/bitcoin-why-traders-must-watch-out-for-96895-if-a-btc-rebound-occurs/