Key Takeaways
What signals suggest Bitcoin may be entering a bullish recovery?
Metrics like Net Unrealized Profit, miner accumulation, and a developing ‘golden cross’ point to a potential rebound.
What could drive Bitcoin’s price toward $130,000 by year-end?
A breakout above $110,000, rising ETF inflows, and favorable macroeconomic data could fuel the rally.
Bitcoin [BTC] has faced sustained selling pressure since reaching an all-time high of $126,199.
It has since lost about 16.89%, at press time, according to data from TradingView. However, signs indicate that market sentiment may be shifting as bulls begin to reemerge.
Early signs of a bullish recovery
Indicators of a potential Bitcoin recovery are starting to surface. The Bitcoin Net Unrealized Profit (NUP) metric suggests that a market bottom could be in place.
Historical data shows that whenever Bitcoin trades below the 0.5 region on the NUP chart, it typically rallies shortly after moving above it.
This pattern occurred in January 2024, July 2024, and April 2025. At the time of writing, the Bitcoin NUP stood at 0.47, signaling that a similar fractal pattern could be forming.

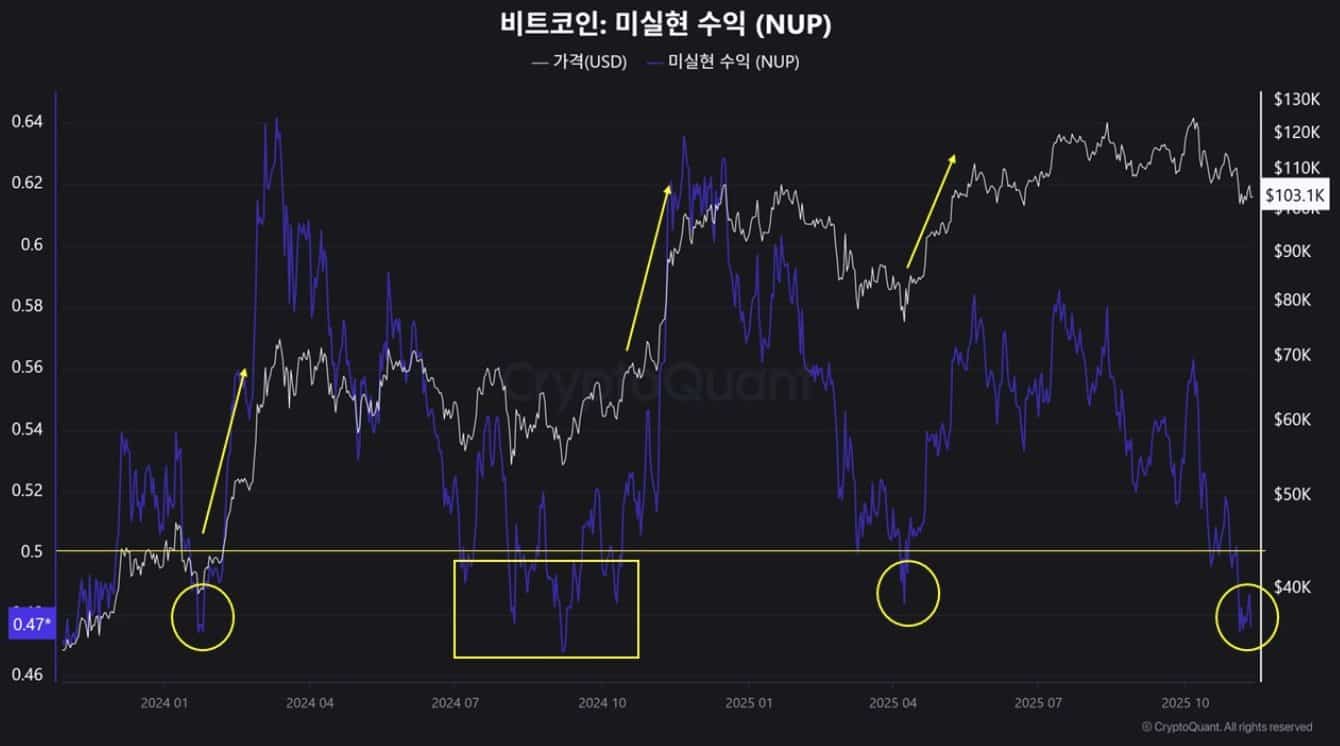
Source: CryptoQuant
Miners also appear to be adjusting accordingly. Data from CryptoQuant shows that the mining index has dropped into the negative zone, and was at -0.3.
This indicates that miners are reducing their selling activity and gradually accumulating more Bitcoin instead.
More bullish patterns are emerging
The Technical Pricing Model, which combines short-term and long-term Moving Averages (SMA) to identify rally signals, also reflects a bullish sentiment.
Specifically, Bitcoin has historically rallied each time the 50-day Moving Average (50DMA) crosses above the 200-day Moving Average (200DMA), a pattern often referred to as the Golden Cross.


Source: Glassnode
This formation has appeared in September 2023, August 2024, and April 2025, each time preceding a significant price increase.
At present, a similar setup is forming, while spot and institutional activity continue to hint at an impending upswing.
Institutional investors have reportedly purchased around $523.98 million worth of Bitcoin recently.
Meanwhile, spot investors have sold approximately $71.9 million worth in the past week, following a much larger $536.58 millionpurchase in the previous month.
Experts see Bitcoin reaching $130,000
Farzam Ehsani, Co-founder and CEO of VALR, believes Bitcoin is showing signs of strength, but the real rally hasn’t started yet. He explained that a breakout above $110,000 could be the key trigger for a stronger bullish trend.
Ehsani added that with the U.S. government shutdown nearing resolution and more macroeconomic data emerging, risk assets like Bitcoin could gain clearer direction. He pointed to inflation and CPI data as potential catalysts.
“[This could be] the beginning of a new upside market cycle and open the door for BTC to retest its previous highs and even head higher towards $130,000 before year-end, especially if ETF inflows pick up again.”
Source: https://ambcrypto.com/bitcoin-to-130k-why-key-data-hints-at-btcs-bullish-reversal/