- Bitcoin is pushing past $119,000, attempting to break out of its recent consolidation range
- The move is a challenge to the key $118,483 resistance level, which analysts have been watching closely
- This comes as the RSI has cooled off from overbought levels, signaling the market has reset for a new move
Bitcoin is pushing past $119,000 on Wednesday, attempting to break out of the tight trading range that has defined its price action since setting an all-time high last week. The move is a direct challenge to the key $118,483 resistance level, a zone that analysts have been watching closely as the critical pivot for the next major move.
Bitcoin has been trading within a narrow zone after its sharp rejection from above $123,000 last week. The 1-hour chart shows high volatility, but this is the first time the price has made a convincing push above the top of the range.
The Battle for the Breakout Level
Trader DaanCryptoTrades recently highlighted the $118,483 level as the key line in the sand. He noted that a clean reclaim of this zone could set up a move back toward the recent all-time high near $123,207. So far, attempts to break above it have failed, with repeated rejections keeping the price capped.
On the downside, support sits around $115,719, with a secondary level marked at $115,215. A breakdown below this area could bring additional selling pressure.
Support sits around $115,719, with a secondary level marked at $115,215. A breakdown below this area could bring additional selling pressure. The current structure points to possible downside if buyers fail to defend that zone.
Price action earlier this week showed signs of recovery, but momentum stalled once it reached the resistance zone. Until that level is cleared, intraday traders may continue working within the tight structure.
Related: Bitcoin (BTC) Price Prediction for July 17, 2025
Bitcoin RSI Shows Neutral Momentum After Pullback
The Relative Strength Index (RSI) shows that Bitcoin’s momentum has cooled down after a recent overbought spike. The RSI crossed above 70 in early July, which often signals that a price rally is stretched. However, the move was short-lived. RSI quickly dropped back below 60, showing that buyers lost strength and the rally faded.
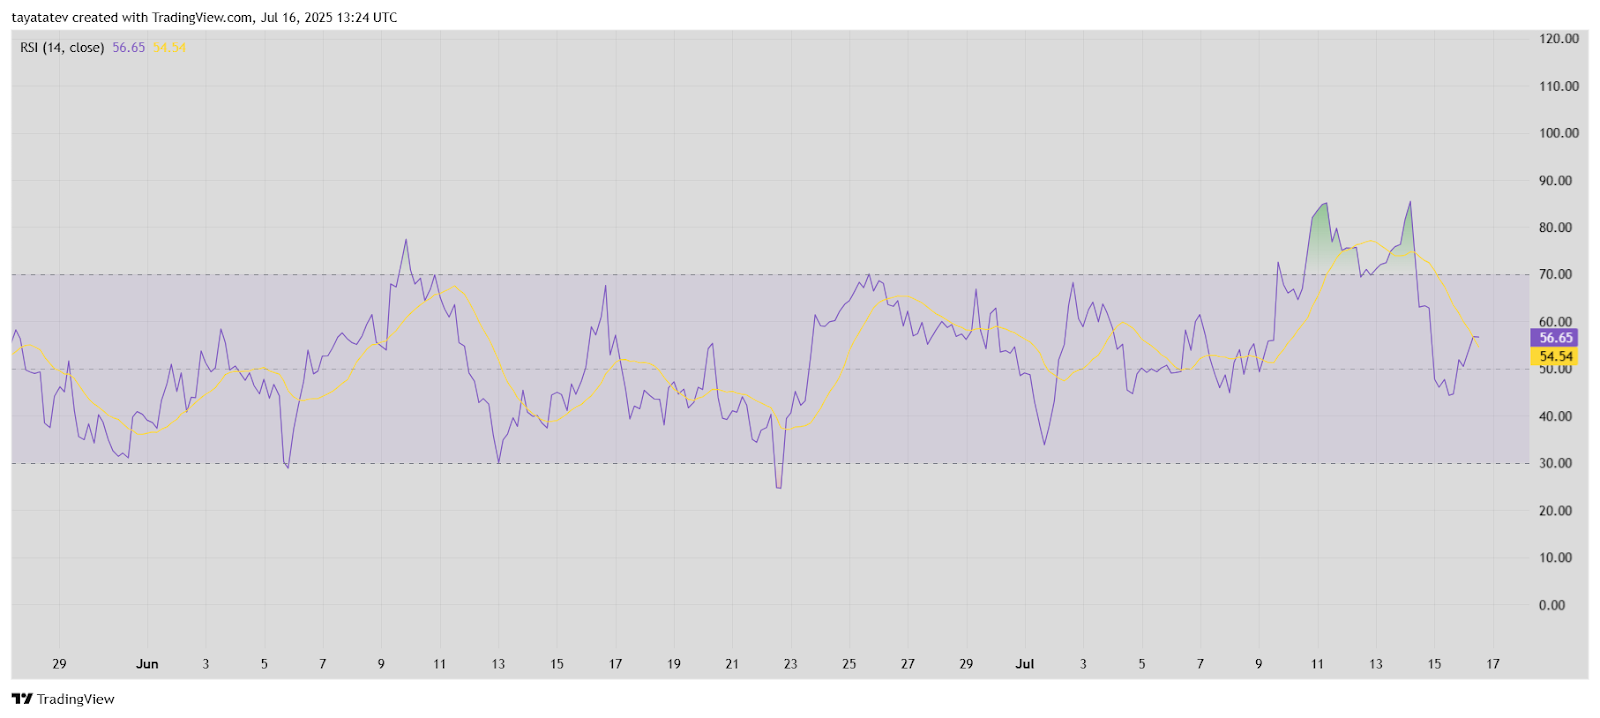

Since then, RSI has stayed between 50 and 60, with the moving average line following closely. This range points to a market without clear direction. The RSI line and its average crossed each other several times, showing choppy conditions and hesitation among traders.
There’s no sign of strong upside or downside pressure right now. Momentum looks balanced, with neither buyers nor sellers in full control. Until RSI breaks above 70 or falls below 30, Bitcoin may stay within its current range.
Macro Factors Driving Volatility
This bullish move for Bitcoin is happening despite some macroeconomic headwinds. U.S. equities recently printed new highs but have seen choppy conditions. A stronger U.S. dollar index (DXY) and rising Treasury yields are also adding pressure to risk assets like crypto.
Earnings season has also started for traditional markets, which often brings added volatility. Combined with the typically lower liquidity seen during the summer months, these factors may contribute to sharp intraday moves in the coming days.
Disclaimer: The information presented in this article is for informational and educational purposes only. The article does not constitute financial advice or advice of any kind. Coin Edition is not responsible for any losses incurred as a result of the utilization of content, products, or services mentioned. Readers are advised to exercise caution before taking any action related to the company.
Source: https://coinedition.com/bitcoin-price-breakout-attempt-above-119k/