- Bitcoin was trading at around $98,000 at press time.
- Sentiment around it remained positive.
As Bitcoin [BTC] inches closer to the psychological $100,000 milestone, market participants are closely monitoring on-chain metrics to decipher the dynamics at play.
While profit-taking activities by long-term holders (LTHs) are evident, the surge in demand from spot Bitcoin ETFs is balancing the equation.
The interplay between these factors could determine the trajectory of BTC’s price in the short to medium term.
Bitcoin’s long-term holder activity and profit-taking
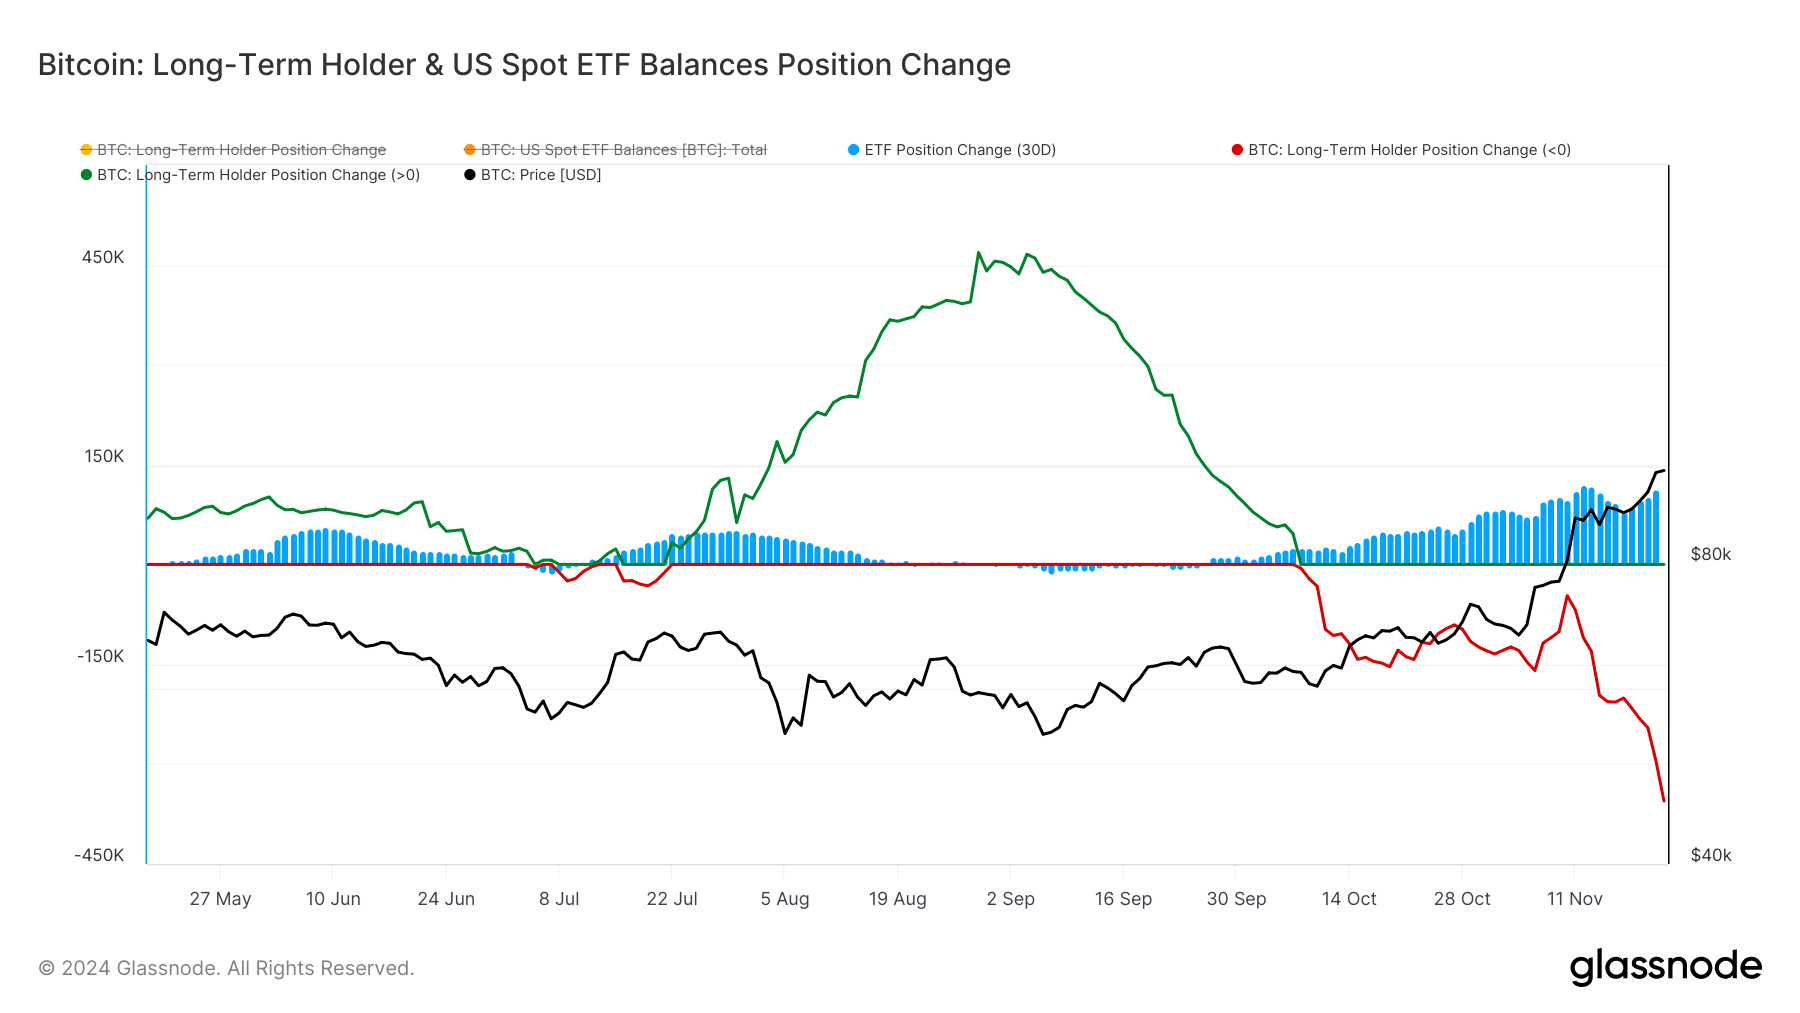
The behavior of LTHs is crucial in understanding Bitcoin’s market stability. Analysis of data from the Long-Term Holder Position Change chart indicated a notable uptick in distribution.
Over the past few weeks, there has been a sharp decline in LTH net positions. The Glassnode chart showed significant profit-taking activities marking this phase.
The shift from accumulation to distribution is common during bull markets, as LTHs capitalize on their long-term holdings.


Source: Glassnode
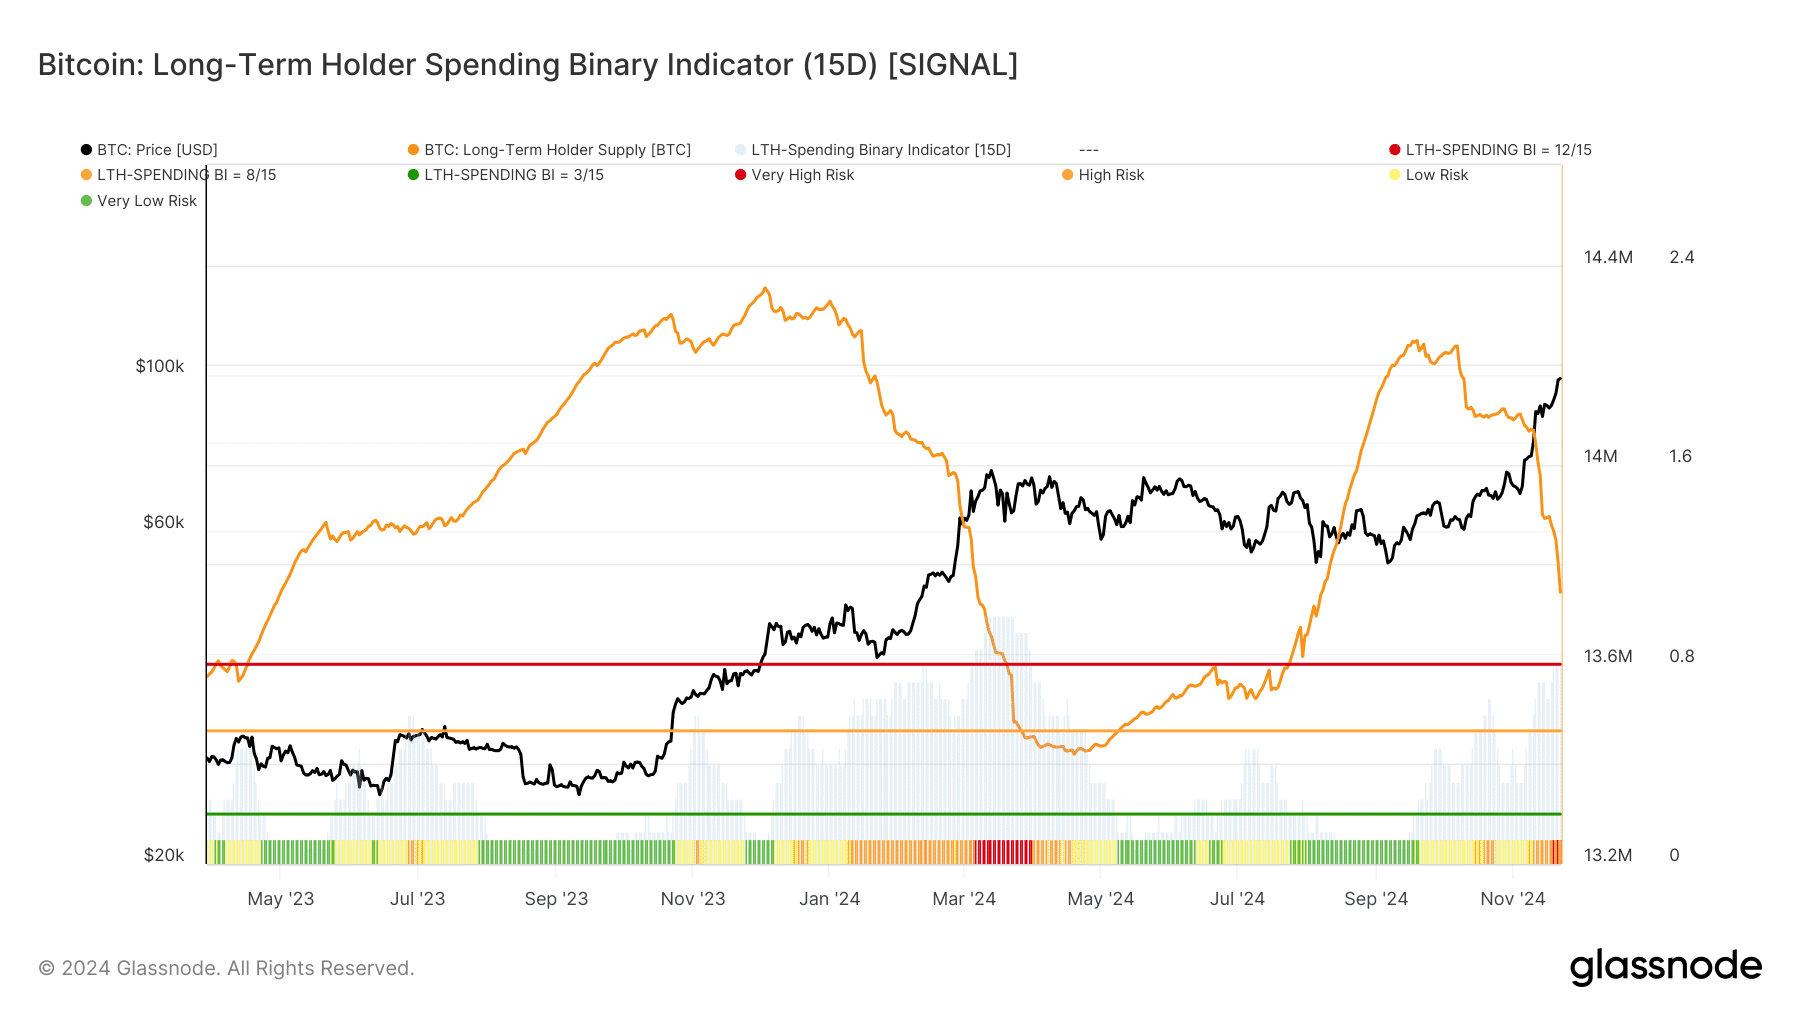
Adding context to this trend is the Long-Term Holder Spending Binary Indicator. The metric, which signals LTHs’ risk levels in terms of profit realization, currently reflects a “High Risk” zone at around 0.8.
Historically, similar risk levels have coincided with local price peaks, suggesting caution for investors banking on a sustained rally beyond $100,000.
Bitcoin ETF demand balances sell-offs
Counterbalancing the sell-off by LTHs is the strong demand for Bitcoin ETFs. The Spot ETF Position Change chart highlights consistent inflows, with over 450,000 BTC allocated to ETFs over the past month.
This influx underscored the appetite of institutional investors, who view ETFs as a simplified entry point into the crypto market.


Source: Glassnode
The ETF flows are playing a pivotal role in absorbing the selling pressure.
In October, when LTH distribution intensified, ETF holdings saw their sharpest rise in months, indicating that demand from new participants and institutions might sustain Bitcoin’s price momentum.
BTC indicators signal bullish continuation
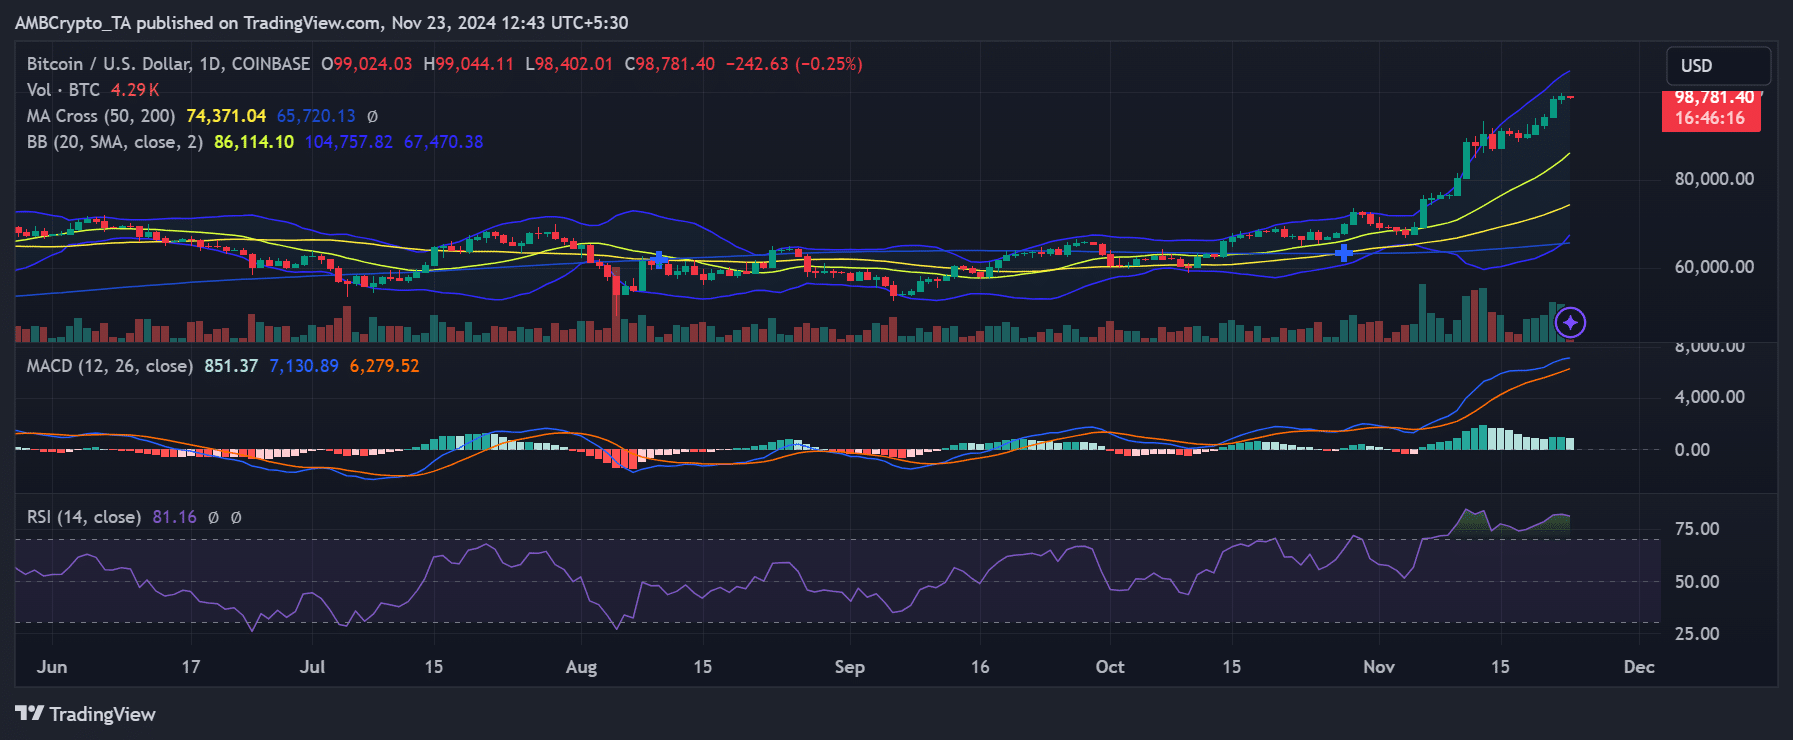
Bitcoin’s daily chart painted a promising technical outlook.
The price remained well above key moving averages, with the 50-day and 200-day Moving Averages, providing strong support levels at $74,000 and $65,000, respectively.
Additionally, the Bollinger Bands suggested heightened volatility, with BTC trading near the upper band—a sign of bullish momentum.


Source: TradingView
Momentum indicators like the MACD and RSI further confirm the positive sentiment.
The MACD was in bullish territory, with the histogram showing growing momentum, while the RSI sat at 81, indicating overbought conditions.
Despite the overbought reading, historical price trends suggest Bitcoin can sustain rallies under such conditions during bull runs.
The interplay between profit-taking by long-term holders and demand from spot Bitcoin ETFs highlights a market balancing act.
Read Bitcoin’s [BTC] Price Prediction 2024-25
While the risk of a correction looms due to elevated LTH activity, the influx of institutional capital via ETFs could support Bitcoin’s bullish momentum.
As BTC approaches $100,000, these metrics will be crucial in shaping its path forward.
Source: https://ambcrypto.com/bitcoin-nears-100k-can-etf-demand-counter-sell-offs/