Key Takeaways
What macro indicators suggest Bitcoin might recover soon?
The Financial Stress Index is currently below zero, signaling low market stress and potential for a short-term rebound.
How are retail and institutional investors reacting to Bitcoin’s decline?
Retail investors are buying aggressively, while institutions are selling—creating a bullish near-term outlook if retail momentum holds.
Bitcoin [BTC] has remained in a bearish trend for over a week since its decline began on the 6th of October.
The asset dropped 18% from its high of $126,000 to around $103,000 on the 10th of October. This bearish sentiment continues to weigh on prices, suggesting a potential end to the current cycle.
AMBCrypto’s research indicates that macroeconomic factors remain a key determinant of whether a bear market has begun, and highlights how these factors could shape Bitcoin’s direction.
Macro factors driving Bitcoin
Bitcoin’s correlation with U.S. macroeconomic conditions stems from its parallel movement with the S&P 500, which has direct exposure to major economic events.
This relationship means that the S&P 500’s reaction to economic indicators often mirrors Bitcoin’s performance, a pattern that has held on multiple occasions.
These macro factors serve as a proxy for where Bitcoin could be heading and whether a bearish phase has begun.
Analyst João Wedson explains,
“Markets don’t crash out of nowhere. There are always early signals—often hidden in the data.”
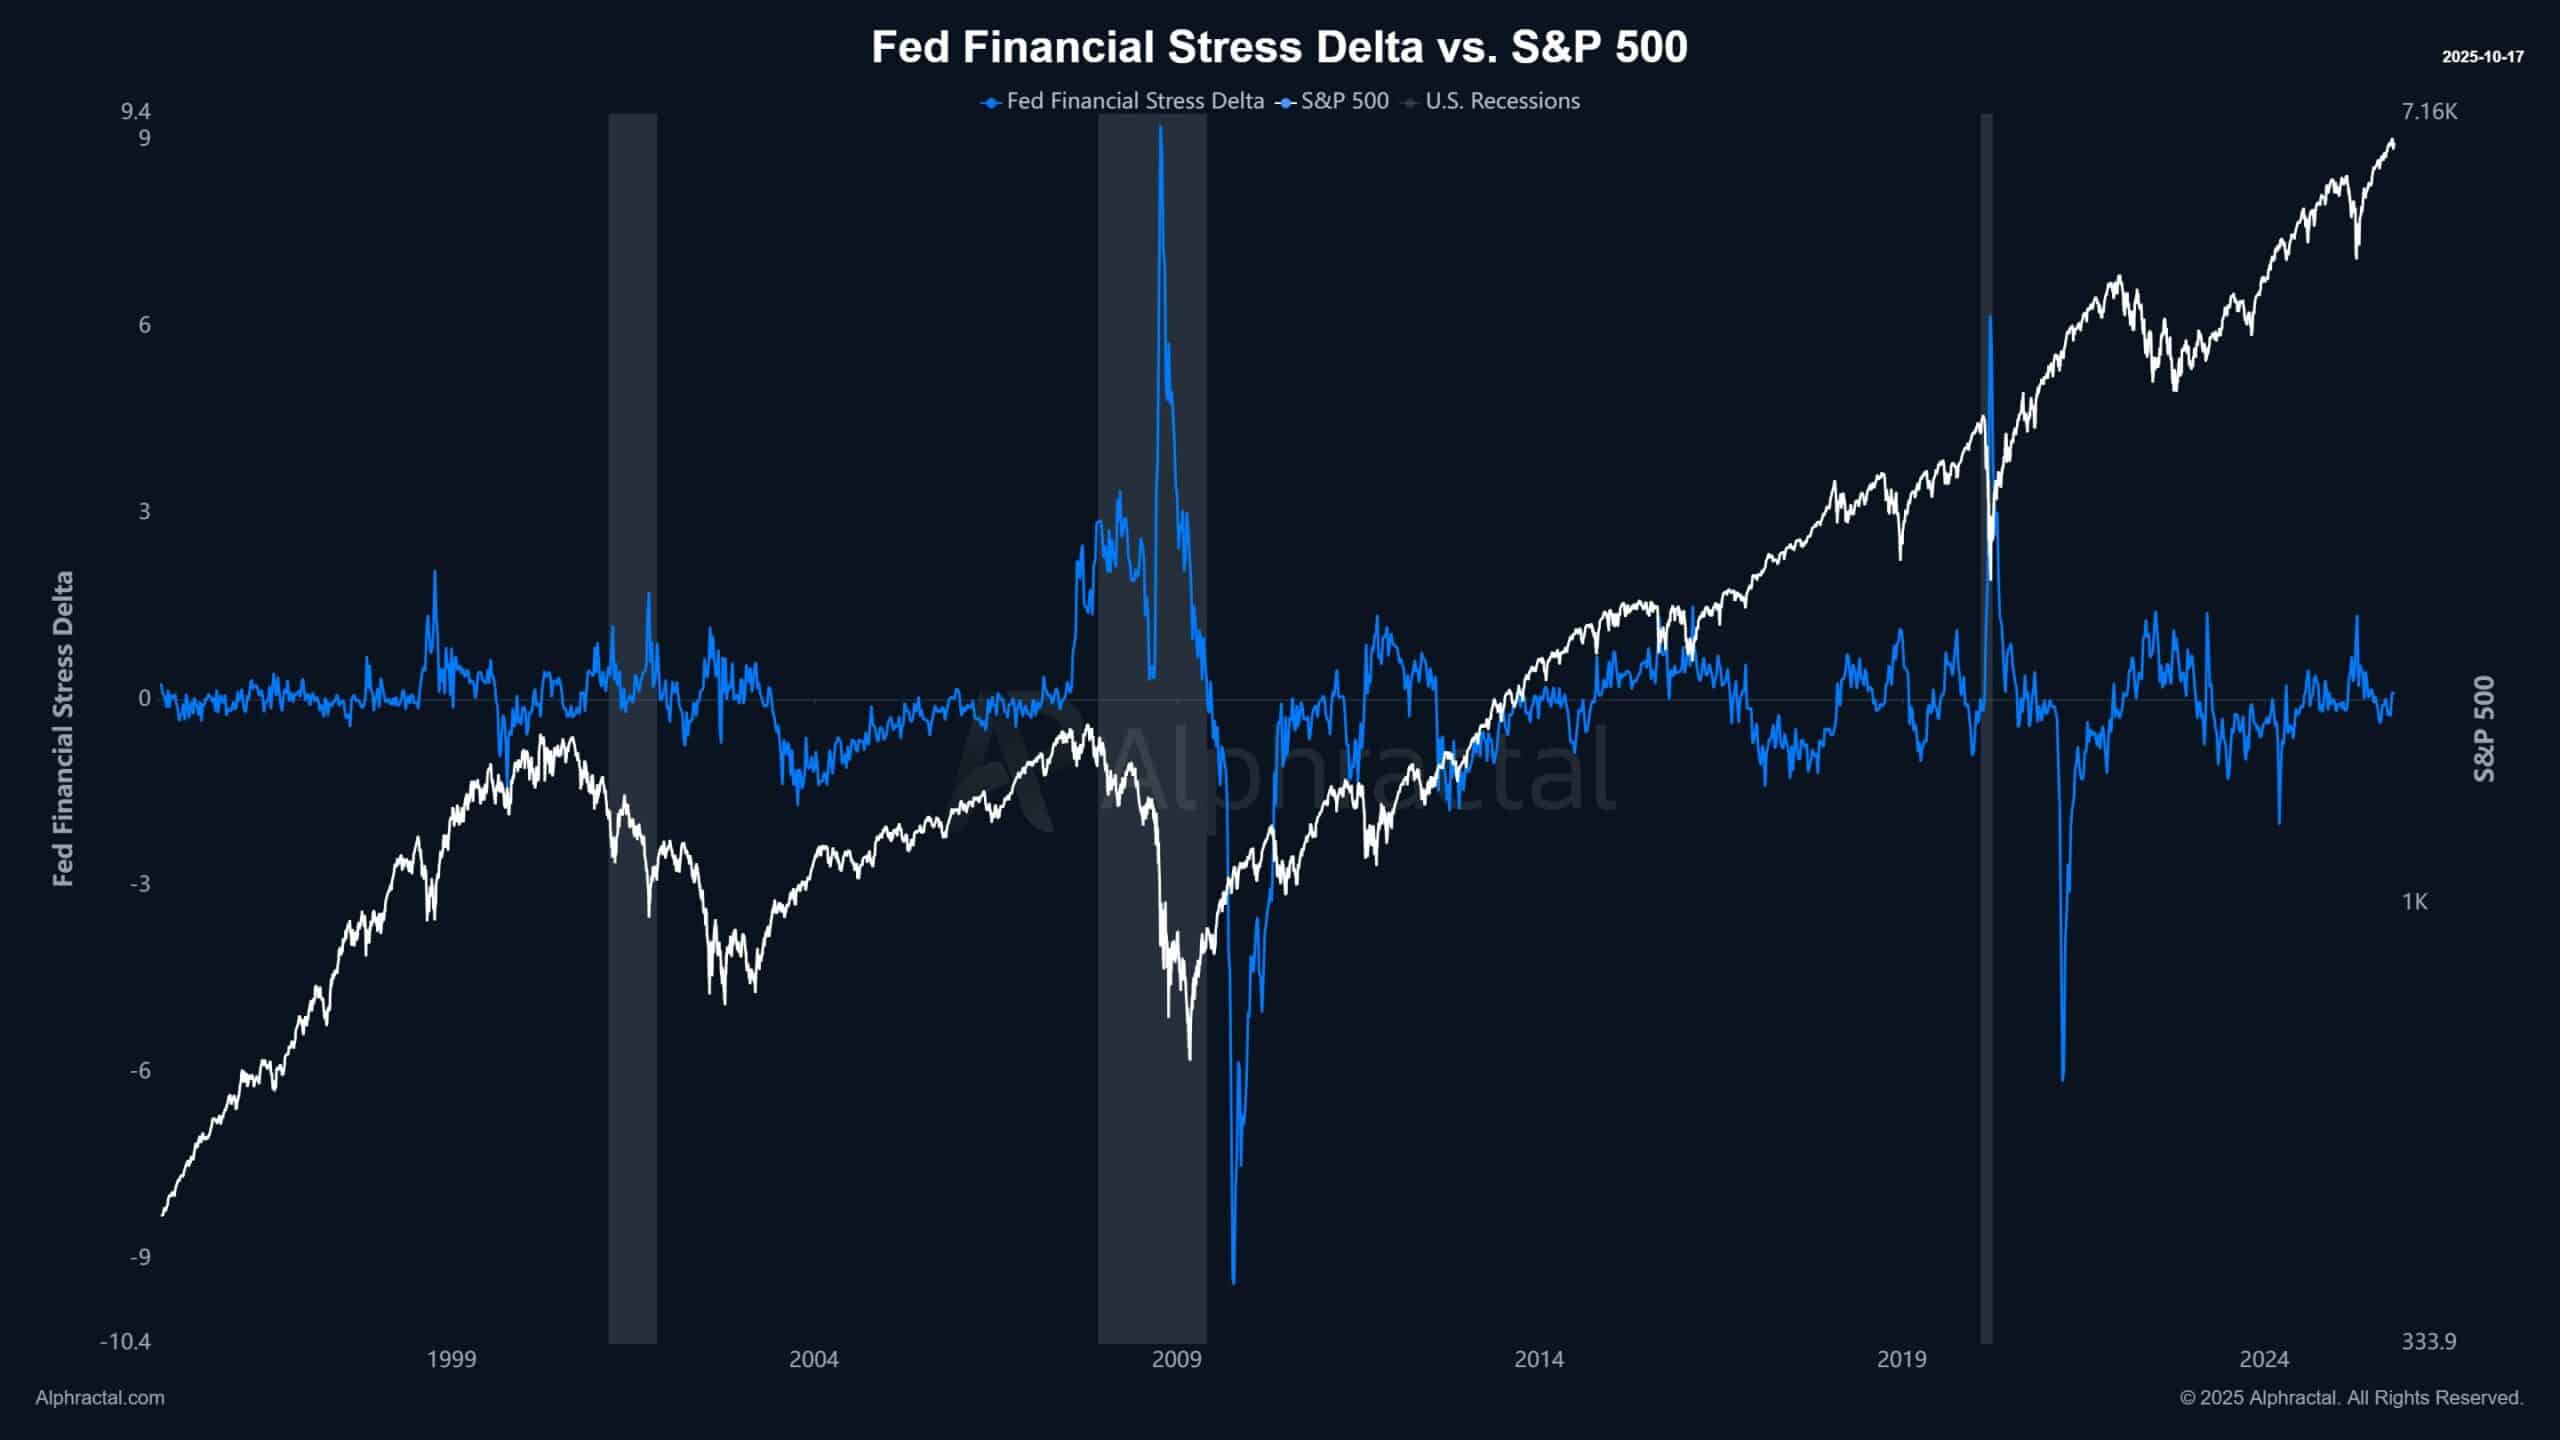
One key metric to watch is the Federal Reserve’s Financial Stress Delta, which helps determine market stress levels as 2026 approaches. This indicator measures whether stress is high or low based on year-over-year data.


Source: Alphractal
A high positive reading indicates elevated stress, often followed by tighter liquidity and price declines. The Delta relies on the Financial Stress Index (FSI), which provides a closer view of underlying market conditions.
Like the Delta, the FSI uses tension levels to gauge market sentiment. A reading above zero implies above-average stress, while a reading below zero signals relative calm.
Currently, the FSI is below zero, suggesting Bitcoin could maintain its upward momentum and potentially recover from recent losses.
Dollar indicators in play
Bitcoin’s movement also depends heavily on the U.S. dollar’s performance, measured by the Trade-Weighted U.S. Dollar Index (Broad).
A higher index indicates a stronger dollar against a basket of other currencies, while a lower value reflects a weaker dollar.
A stronger dollar typically reduces market liquidity, pressuring Bitcoin and other assets to trend lower. Conversely, a weaker dollar tends to boost liquidity and asset prices.


Source: Alphractal
Similarly, the “Inflation vs. Expectation” chart offers another critical signal. When actual inflation far exceeds expectations, the Federal Reserve often responds with tighter monetary policies—reducing liquidity and driving asset prices, including Bitcoin, downward.
For now, market indicators remain calm, with no clear sign of an imminent downturn. This suggests a possible short-term rally for Bitcoin.
Retail and institutional investors diverge
Retail and institutional investors remain divided on Bitcoin’s next direction.
Recent data shows that retail traders are largely bullish. Between the 13th and the 17th of October, they acquired about $1.66 billion worth of Bitcoin and moved it into private wallets, with sellers failing to dominate on any day during the period.

Source: CoinGlass
In contrast, institutional investors have offloaded roughly $1.23 billion worth of Bitcoin back to the market, according to SoSoValue data.
This divergence shows that retail investors expect a short-term rally and have absorbed much of the liquidity sold by institutions, reinforcing a bullish near-term outlook.
However, if retail momentum fades, Bitcoin could once again slip lower on the charts.
Source: https://ambcrypto.com/bitcoin-how-these-macro-factors-could-drive-btcs-next-move/