Key Takeaways
What do recent on-chain indicators suggest about Bitcoin’s near-term outlook?
Indicators like a rising Bid-to-Ask Ratio and low Bubble Index suggest Bitcoin may be poised for a bullish move.
How is Bitcoin’s market dominance influencing investor sentiment?
With dominance rising to 59.1%, Bitcoin is attracting more liquidity, reinforcing its role as the market’s anchor.
Bitcoin [BTC] could witness renewed demand in the coming weeks as key on-chain indicators suggest a potential market shift.
The asset has consolidated over the past three days, trading between $101,000 and $103,000.
At press time, the asset exchanged hands at $102,289. This consolidation reflects a temporary balance between buyers and sellers, keeping price volatility contained.
Long-term holders put pressure on Bitcoin
Typically, market dynamics rely on the balance between buyers and sellers. However, this equilibrium has recently shifted.
Long-term holders (LTHs), who control a significant portion of Bitcoin’s supply, have started selling their assets amid weakening demand.
Between November and December 2024, and again from January to March 2025, these holders sold portions of their holdings, but strong demand at the time offset the impact.


Source: CryptoQuant
That trend has now changed. Charts show a decline in apparent demand over the past thirty days as LTHs continue to sell, creating downward pressure on prices.
Meanwhile, the liquidation heatmap shows Bitcoin trapped between two key liquidity clusters. Price movement toward either cluster could define the asset’s next major trend.
Liquidity zones often attract price action, and the current levels stand at $105,000 on the bullish side and $98,000 on the bearish side.
A decisive move beyond either boundary could signal where Bitcoin’s next leg will head.
Where is Bitcoin likely to tilt?
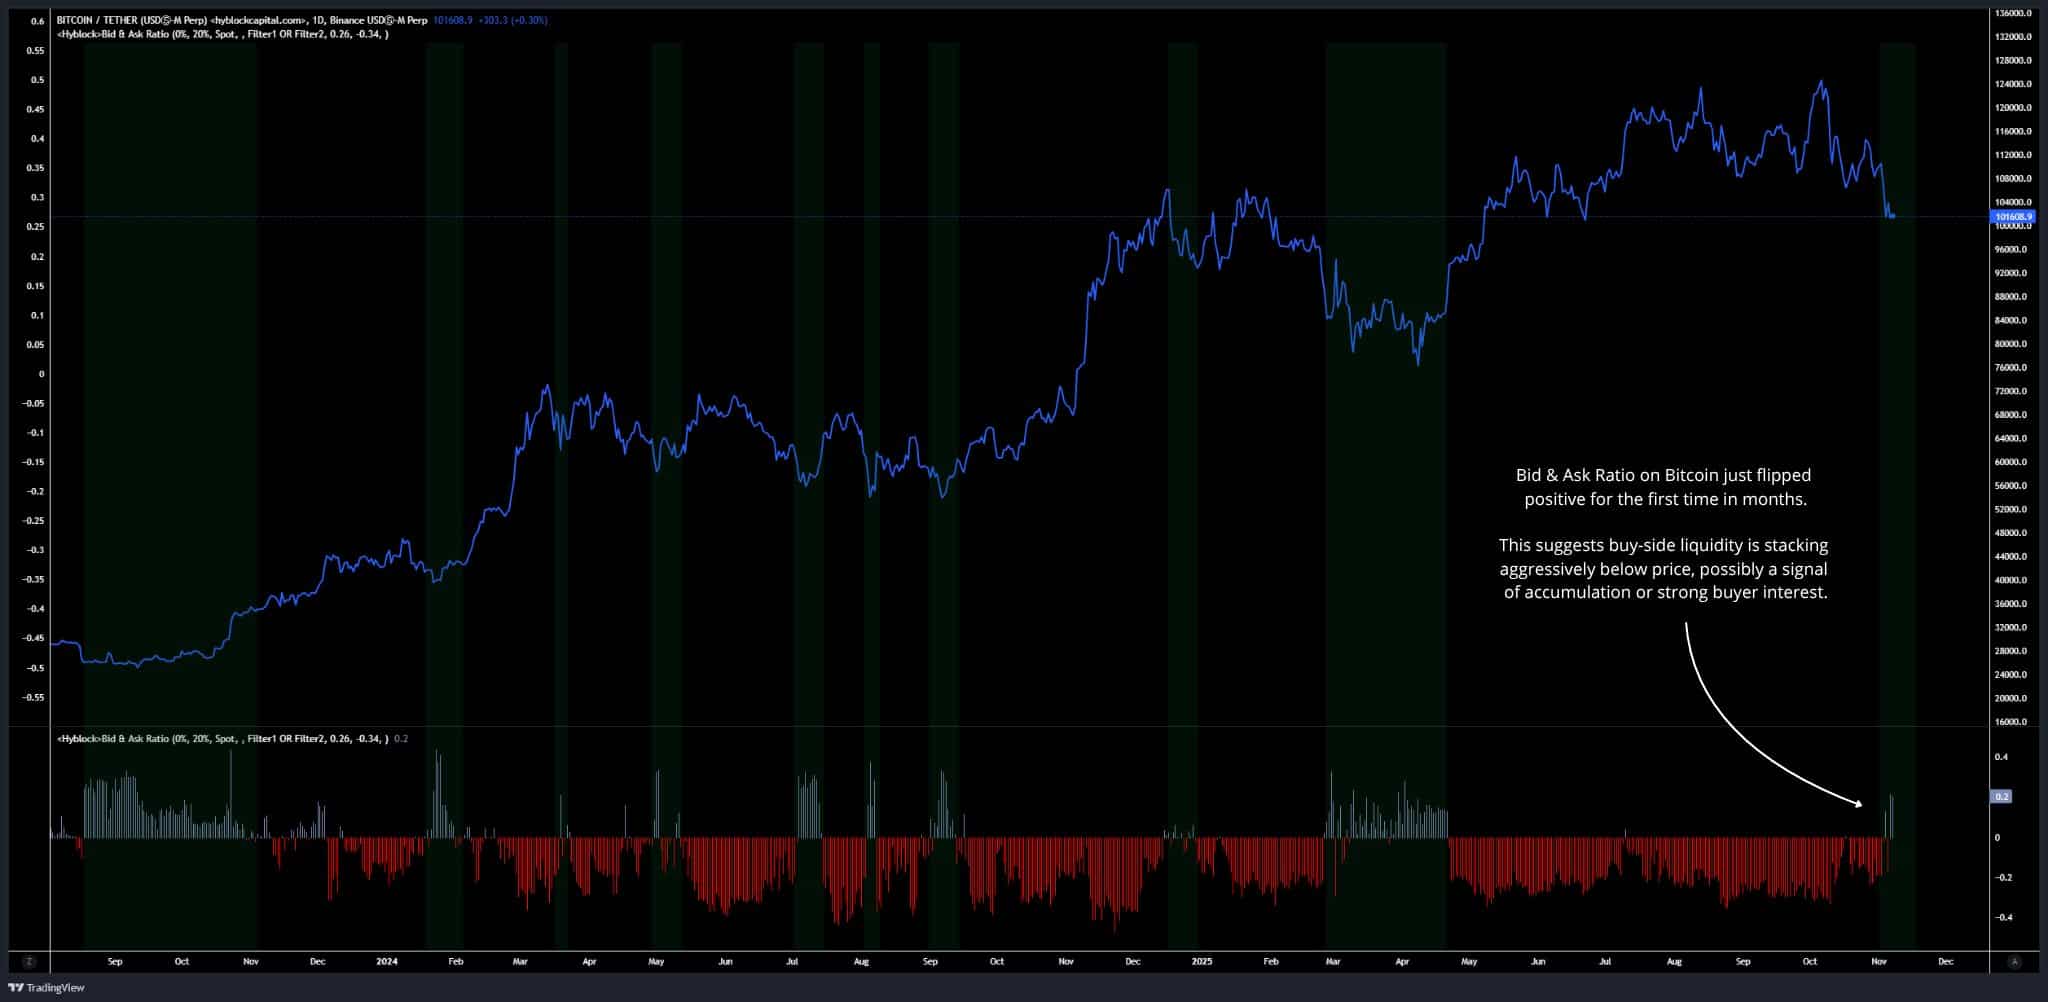
Market fundamentals suggest that bulls could soon make a move. The Bid-to-Ask Ratio, which measures buy-side versus sell-side liquidity, has turned positive for the first time in months, and was sitting at 0.2, at press time.
This reading indicates that buyer liquidity is building as investors begin accumulating Bitcoin.

Source: CryptoQuant
Historically, a similar shift between March and April preceded a major upside move in Bitcoin’s price.
Additionally, the Bitcoin Bubble Index, which gauges whether Bitcoin is in a bullish or bearish phase and identifies potential market tops or bottoms, supports this view.
Typically, a reading near 139 signals a market top. At present, the index stands at 13.46, indicating that the market remains far from its peak and that Bitcoin still has room to rally.
Dominance builds gradually
Bitcoin’s market dominance has remained relatively stable over the past thirty days, reflecting a balance between liquidity inflows and outflows.
In the past 24 hours alone, Bitcoin dominance has risen 0.71%, at press time, bringing its share of total crypto market capitalization to 59.1%.


Source: CoinMarketCap
The total crypto market cap currently sits at $3.45 trillion. A continued rise in dominance suggests that more liquidity is flowing into Bitcoin, reinforcing its position as the market’s focal point.
For now, while long-term holders continue to sell, there’s a strong possibility that fresh demand will begin to build, potentially setting the stage for Bitcoin’s next bullish phase.
Source: https://ambcrypto.com/bitcoin-how-renewed-demand-could-catch-btc-bears-off-guard/