Since last week, the pioneer cryptocurrency BTC has showcased low volatility as its price seeks support at the $95,000 floor. The consolidation displays several neutral candles in the daily chart, indicating no clear initiation from buyers to sellers. However, the state of Bitcoin mining operations highlights an ideal buy opportunity for investors in the mid-term and long-term.
According to CoinGecko data, the BTC price currently trades at $96,434, with an intraday loss of 1.06%. Meanwhile, the asset’s market cap is at $1.913 Trillion
Key Highlights:
- Since mid-December 2024, the Bitcoin price has been consolidated strictly between two horizontal levels of $108,022 and $91,172.
- The BTC price breakdown below the 20-and-50-day exponential moving average indicates the near-term trend is bearishness.
- CryptoQuant reports that Bitcoin’s Hash Ribbons indicator is signaling miner capitulation, historically linked to market bottoms.
Bitcoin Miners Capitulate: Hash Ribbons Flash a Key Recovery Signal
Bitcoin miners are showing signs of capitulation once again, as indicated by the Hash Ribbons metric, a historically reliable signal for market bottoms. According to CryptoQuant’s latest report, the Hash Ribbons have begun flashing, suggesting that mining activity is under pressure.
This tool assesses the state of Bitcoin mining operations using 30-day and 60-day moving averages (MA) of the Bitcoin network’s hash rate. A bearish crossover of the 30- and 60-day EMAs signals miner capitulation, a period when mining becomes unprofitable for reasons like high operating costs, rising network difficulty, or low BTC value.


Historically, this signal has often preceded strong Bitcoin rallies with only one major expectation during the COVID-19 crash.
BTC Hints Temporary Pullback Before a Leap to $120k
In the last three weeks, the Bitcoin price has plunged from $109,365 high to $96,531, projecting a loss of 11.75%. This downswing signals the continuation of BTC’s sideways trend between the $108,022 and $91,172 horizontal levels.
Following 2024’s year-end rally, analysts consider this consolidation as a temporary pullback for buyers to regain bullish momentum.
If the broader market uncertainty prolongs, the coin price could plunge 5.5% to seek support at the range bottom. The 100-day EMA wavering at $91,172 offers buyers with additional backing to sustain higher levels.

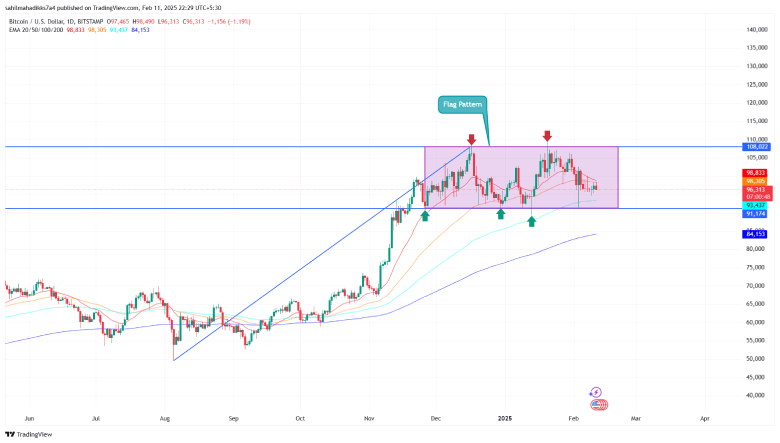
For buyers to regain control, a bullish breakout from $108,022 resistance could accelerate the bullish momentum and drive a potential rally to $120,000, followed by $150,000.
Also Read: Thailand to Launch Phuket Bitcoin Sandbox, Initiative Applauded by CZ
Source: https://www.cryptonewsz.com/bitcoin-hash-ribbons-buy-120k-rally/