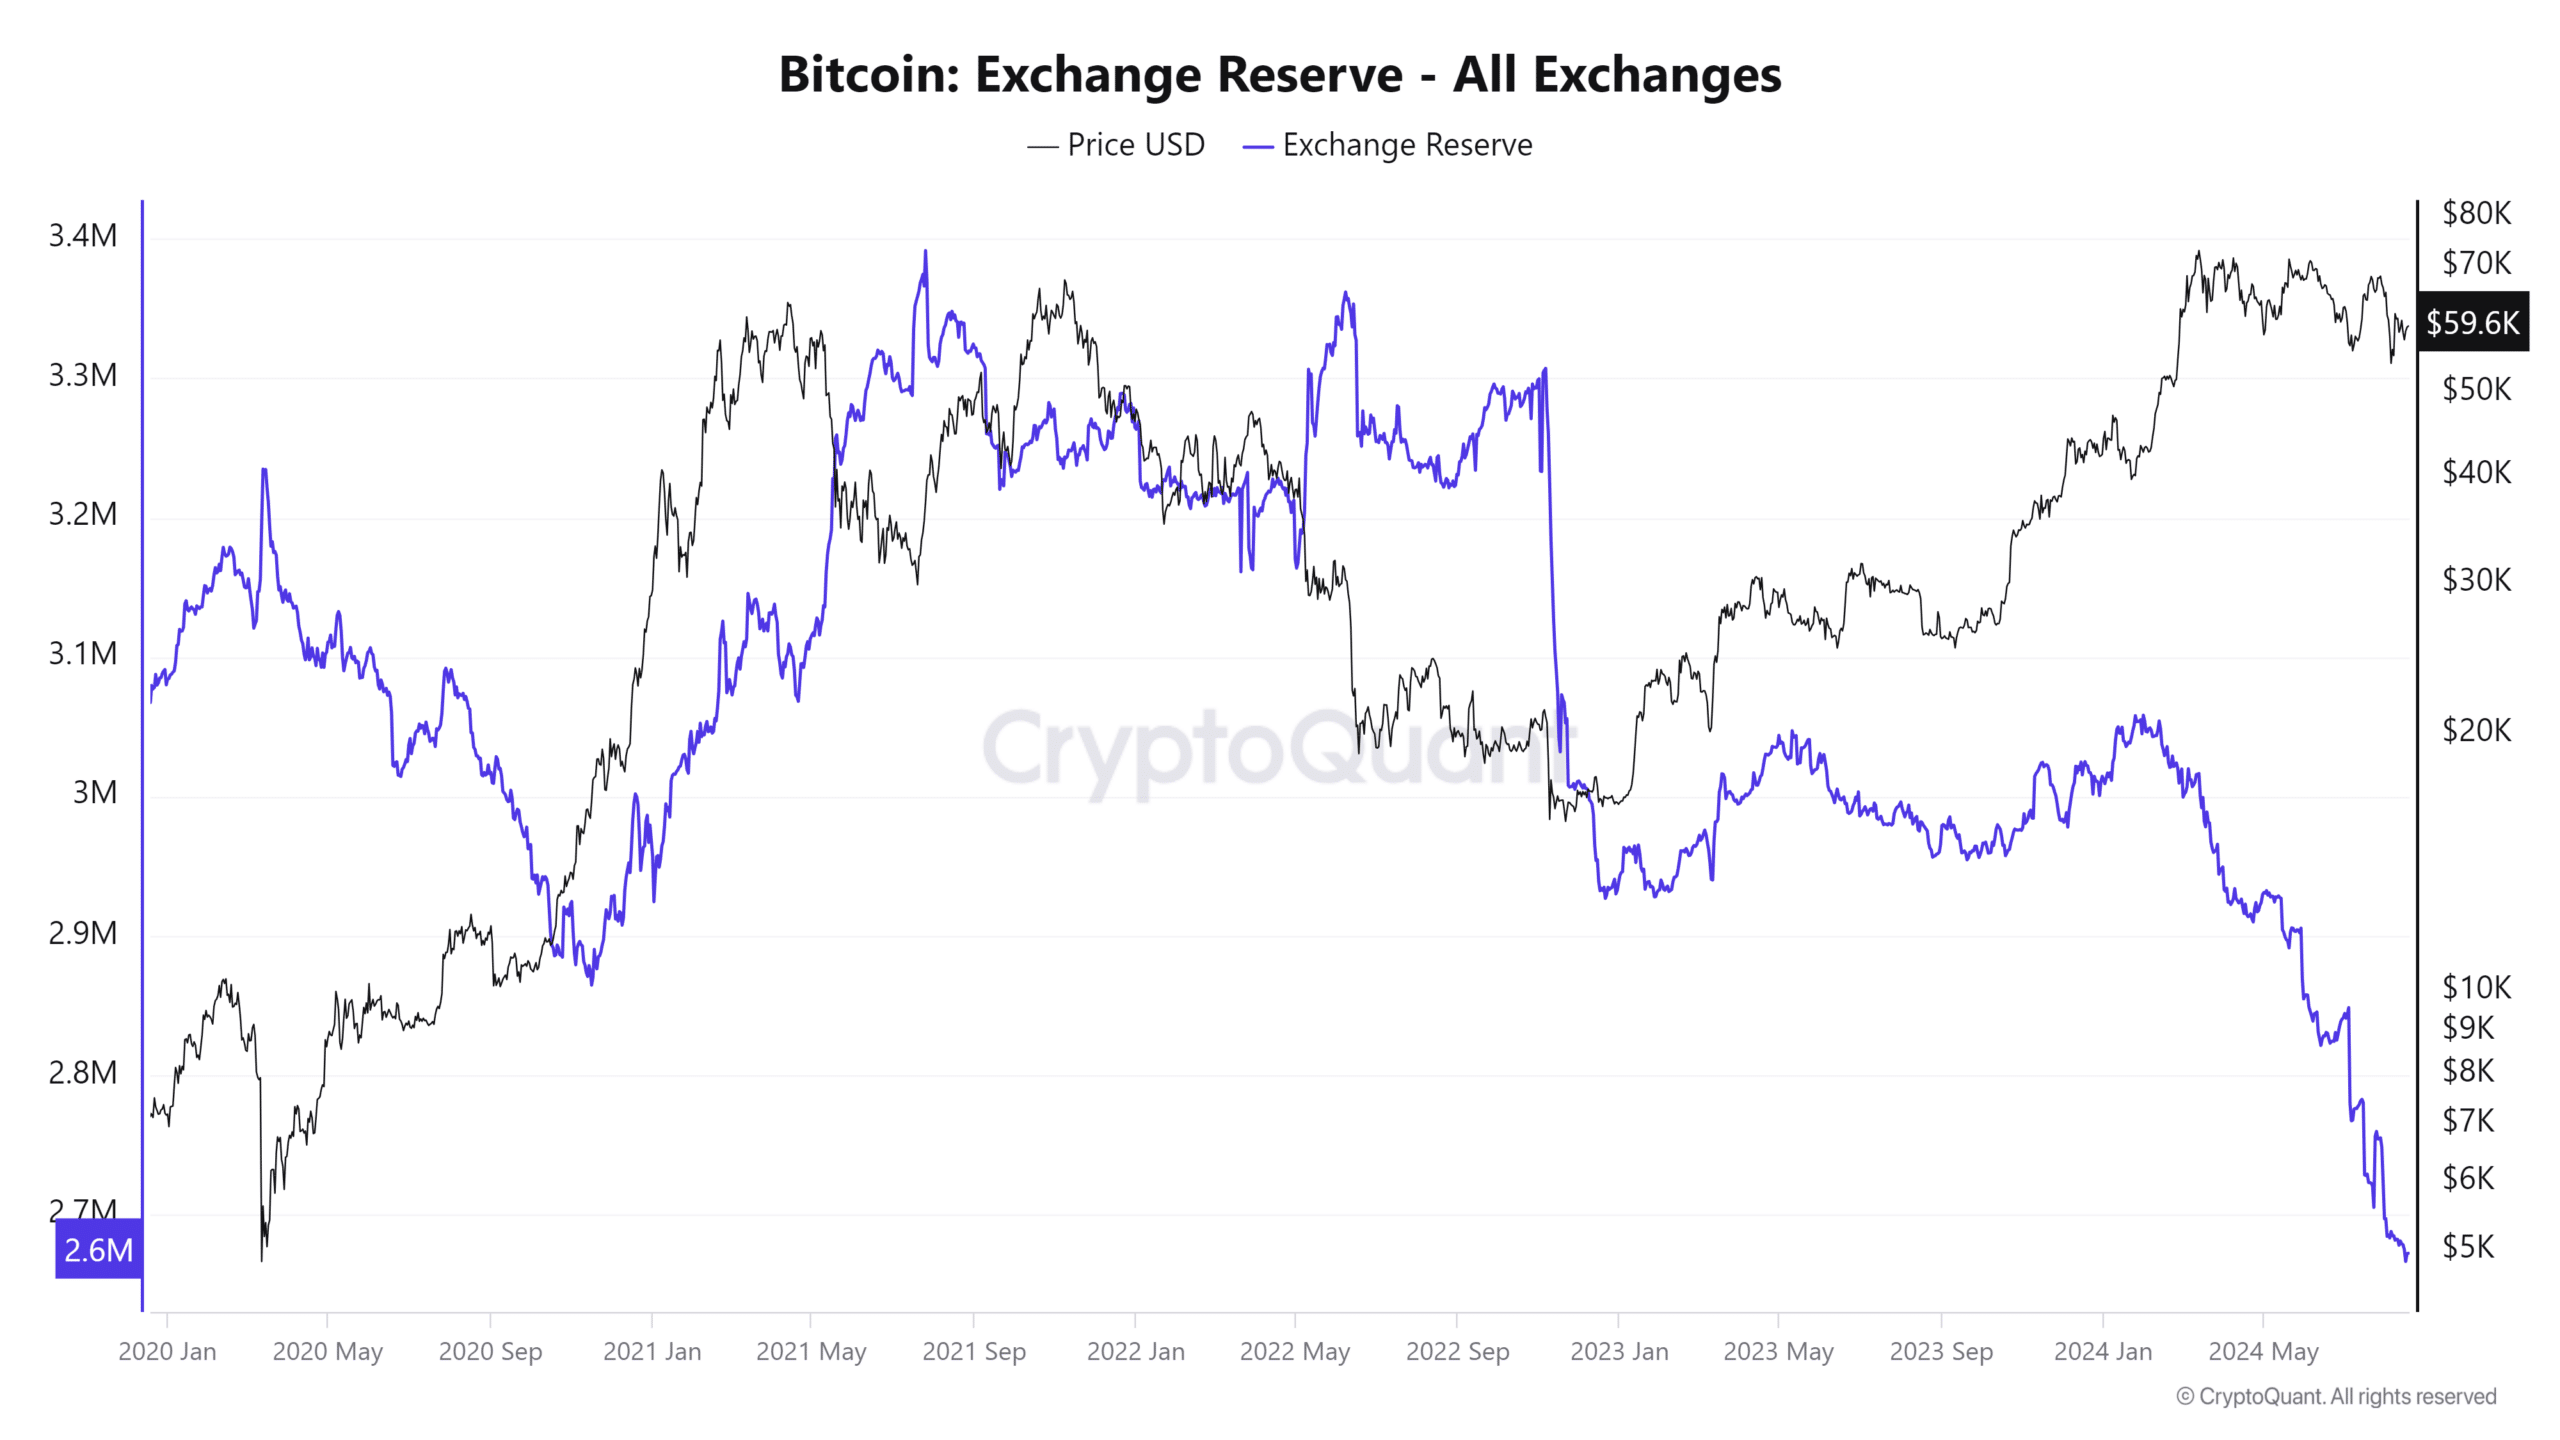
- The BTC exchange reserve declined to around 2.6 million.
- This is the lowest level in over four years.
Bitcoin’s [BTC] exchange reserve has recently fallen to its lowest level in years, a significant development that comes at a time when BTC’s price is struggling to gain upward momentum.
While the current price action may appear concerning, this drop in exchange reserves could be a positive signal for Bitcoin’s future price.
Bitcoin exchange reserves drop
AMBCrypto’s analysis of Bitcoin’s exchange reserves on CryptoQuant revealed significant developments, with reserves declining to their lowest level since 2020.
The chart indicated that Bitcoin’s reserves on exchanges have dropped from over 3.2 million BTC in early 2020 to approximately 2.6 million BTC.
Exchange reserves represent the amount of Bitcoin held on exchanges, available for immediate trading.
When reserves are high, it suggests an increased supply on exchanges, which can lead to heightened selling pressure and potentially lower prices.
Conversely, as reserves decrease, the available supply for trading diminishes, which can support price increases due to reduced selling pressure.


Source: CryptoQuant
The ongoing decrease in exchange reserves likely indicates that investors are withdrawing their Bitcoin from exchanges to store it in private wallets.
This shift can lead to lower selling pressure in the market, creating a favorable environment for price appreciation.
Notably, the chart highlights sharp drops in exchange reserves around late 2022 and mid-2023, coinciding with Bitcoin’s price climbing.
This pattern supports the idea that lower exchange reserves contribute to bullish price action. Reduced availability on exchanges can drive up prices when demand remains steady or increases.
The current price trend
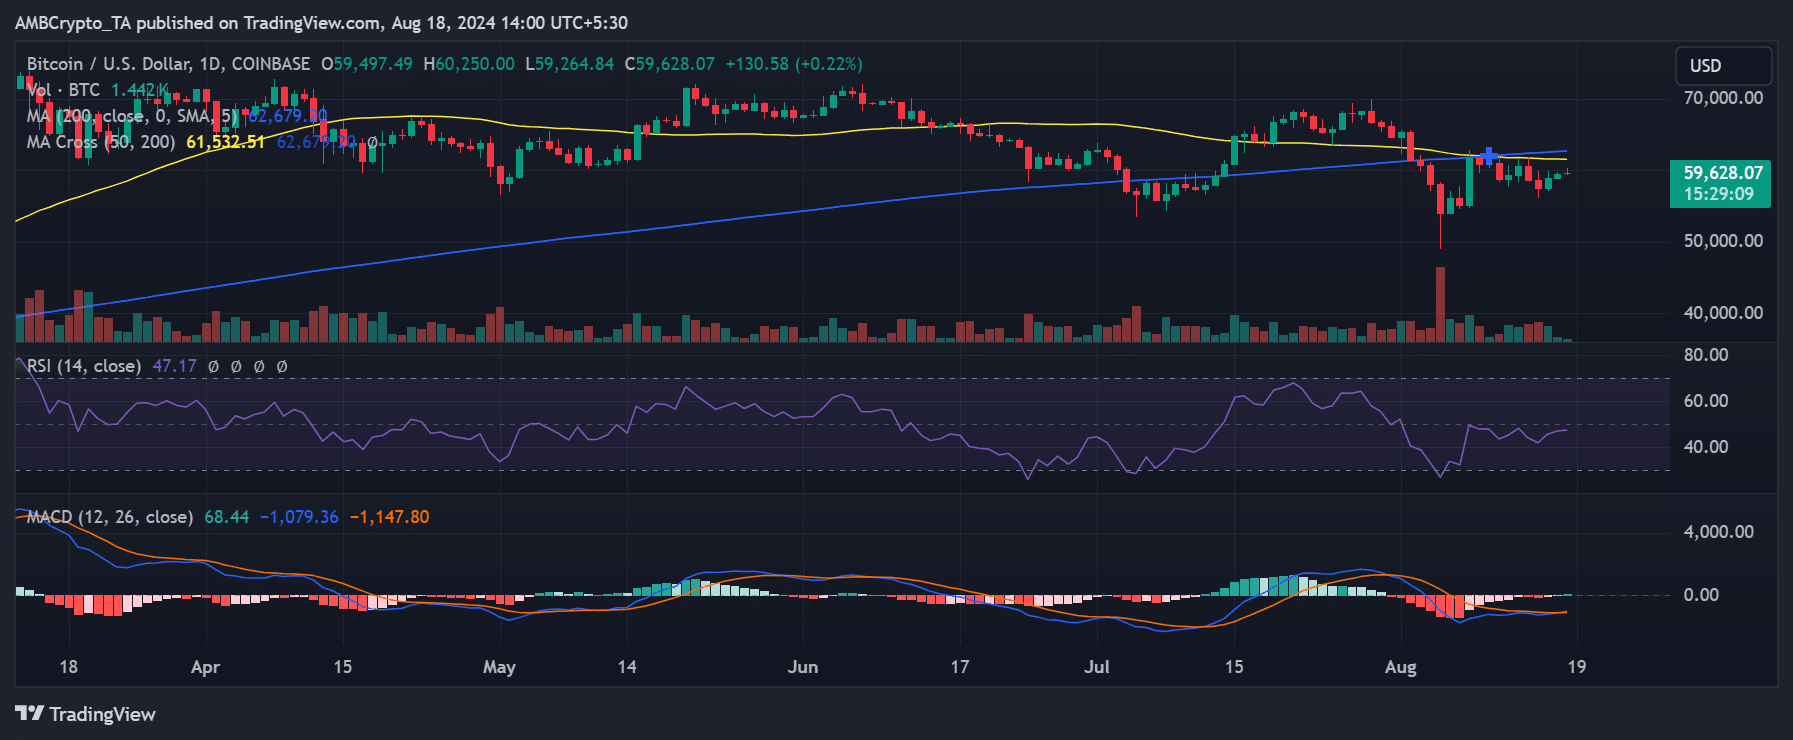
According to AMBCrypto’s analysis, Bitcoin was trading at approximately $59,628.07 at press time, showing a slight increase of over 0.22%.
However, it faced significant resistance at the $61,532.51 and $62,679.20 price levels, marked by the long and short moving averages (blue and yellow lines).


Source: TradingView
The Relative Strength Index (RSI) was at 47.17, slightly below the neutral 50 level, suggesting mild bearish momentum in the market.
Although the Moving Average Convergence Divergence (MACD) was positive at 68.44, the signal line remained negative at -1,147.80.
The MACD histogram indicated diminishing bearish momentum, but has not yet strengthened enough to signal a bullish reversal.
How the reserve trend could impact BTC
Despite the current bearish indicators on Bitcoin’s chart, the ongoing decline in exchange reserves suggested a different narrative may unfold.
Market participants were moving their Bitcoin off exchanges, potentially for long-term holding, which could reduce selling pressure and provide underlying support for the price.
If this trend of declining exchange reserves continues, it could act as a counterbalance to the bearish technical setup.
Even though technical indicators currently point to weakness, the reduced availability of BTC on exchanges might stabilize the price or even contribute to a gradual rise due to scarcity.
Read Bitcoin’s [BTC] Price Prediction 2024-25
However, if Bitcoin’s price continues to struggle below these moving averages and the RSI weakens further, there could still be room for a deeper decline before finding meaningful support.
While the declining exchange reserves might limit the severity of any sell-off, they may not entirely prevent it.
Source: https://ambcrypto.com/bitcoin-exchange-reserves-drop-to-2020-lows-what-it-means-for-btc/