Bitcoin Analysis
Bitcoin’s price was mostly static for its daily session on Monday and concluded its daily candle in red figures and -$218.
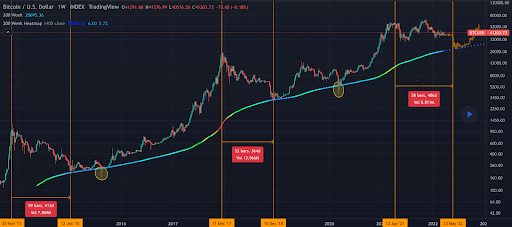
The first chart we’re looking at today is the BTC/USD 1W chart below from Sporia. The chartist points out that historically the drawdown from the peak of each cycle to the 200 week moving average is 400 days.
The 200 week moving average for BTC is $20,695.36, at the time of writing.

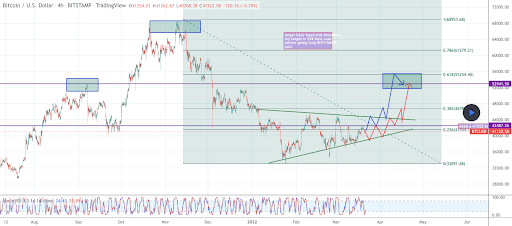
The second bitcoin chart we’re analyzing today is the BTC/USD 4HR chart from candlestickninja. Bitcoin’s price is trading between the 0 fib level [$33,091.68] and 0.236 [$41,555.1].
The chartist posits that the current rally is a bear market rally and that the potential targets before reversal are 0.236, 0.382 [$46,793.07] and finally the 0.618 fib level [$55,254.40]. The chartist also believes after reversing course at the 0.618 BTC’s price will eventually drop to the low $30k level.

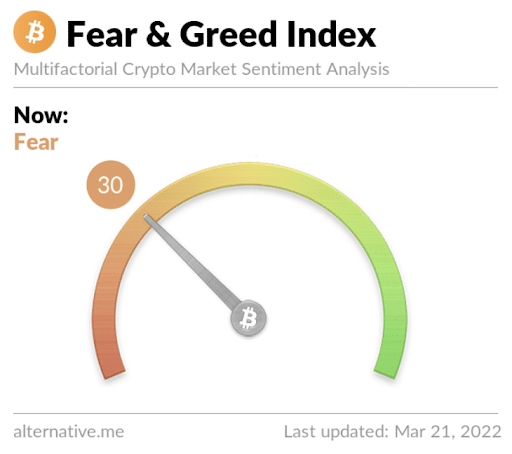
The Fear and Greed Index is 30 Fear and is -1 from Monday’s reading of 30 Fear.

Bitcoin’s Moving Averages: 5-Day [$40,817.36], 20-Day [$40,154.79], 50-Day [$40,448.78], 100-Day [$47,006.80], 200-Day [$45,798.60], Year to Date [$40,804.94].
BTC’s 24 hour price range is $40,615-$41,480 and its 7 day price range is $38,389-$42,241. Bitcoin’s 52 week price range is $29,341-$69,044.
The price of bitcoin on this date last year was $54,370.
The average price of BTC for the last 30 days is $39,981.
Bitcoin’s price [-0.53%] closed its daily candle worth $41,031 and in red figures for the first time in three days on Monday.
Ethereum Analysis
Ether’s price bucked the macro trend and rallied higher during its daily session on Monday. ETH concluded its daily candle +$29.97 to start the new week.
The ETH/USD 1D chart below by jacksonhdr shows Ether’s price currently at its demand line. Ether’s price is trading between 0.382 [$2,789.32] and 0.5 [$3,184.08].
The primary target overhead for bullish Ether traders is 0.5, followed by 0.618 [$3,578.83] with a third target of 0.786 [$4,140.86].
Conversely, bearish Ether traders are looking to push ETH’s price below 0.382 and then test 0.236 [$2,300.89]. If they’re successful pushing ETH’s price below the 0.236 fibonacci level, the third target for bearish traders is 0 [$1,511.38].

Ether’s Moving Averages: 5-Day [$2,817.44], 20-Day [$2,713.81], 50-Day [$2,829.90], 100-Day [$3,489.94], 200-Day [$3,228.32], Year to Date [$2,898.69].
ETH’s 24 hour price range is $2,832-$2,955 and its 7 day price range is $2,519-$2,974. Ether’s 52 week price range is $2,709.33.
The price of ETH on this date in 2021 was $1,686.89.
The average price of ETH for the last 30 days is $2,709.33.
Ether’s price [+1.05%] closed its daily candle on Monday worth $2,891.76 and back in green figures after closing Sunday in red figures.
Matic Analysis
Matic’s price was static for the majority of its daily session on Monday and concluded its daily candle at exactly the same price that Sunday’s candle closed.
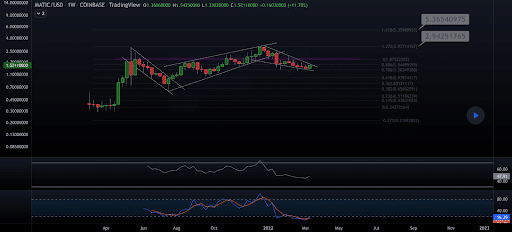
The third chart we’re analyzing today is the MATIC/USD 1W chart below from HOOPFOOD.

The targets overhead for bullish Matic traders are the 1 fibonacci level [$1.87] followed by 1.272 [$2.97] and 1.618 [$5.35].
From the perspective of bearish traders, they’re aiming to snap the 0.886 and send Matic’s price down to test the 0.786 fib level [$1.30]. If they achieve pushing Matic’s price below 0.786, the third target for bearish traders is 0.618 [$.979].
Matic’s +272.95 against The U.S. Dollar for the last 12 months, +432.2% against BTC, and +129% against ETH over the same duration, at the time of writing.
Matic’s 24 hour price range is $1.44-$1.5 and its 7 day price range is $1.34-$1.53. Matic’s 52 week price range is $0.3-$2.92.
Matic’s price on this date last year was $0.347.
The average price of MATIC over the last 30 days is $1.47.
Matic’s price [0.00%] closed even for its daily session on Monday and was worth $1.465 when traders settled up.
Source: https://en.cryptonomist.ch/2022/03/22/bitcoin-ethereum-matic-price-analyses-2/