Bitcoin Analysis
Bitcoin’s RSI is at its highest levels on the daily timescale of 2022 and finished its daily candle on Sunday +$969.
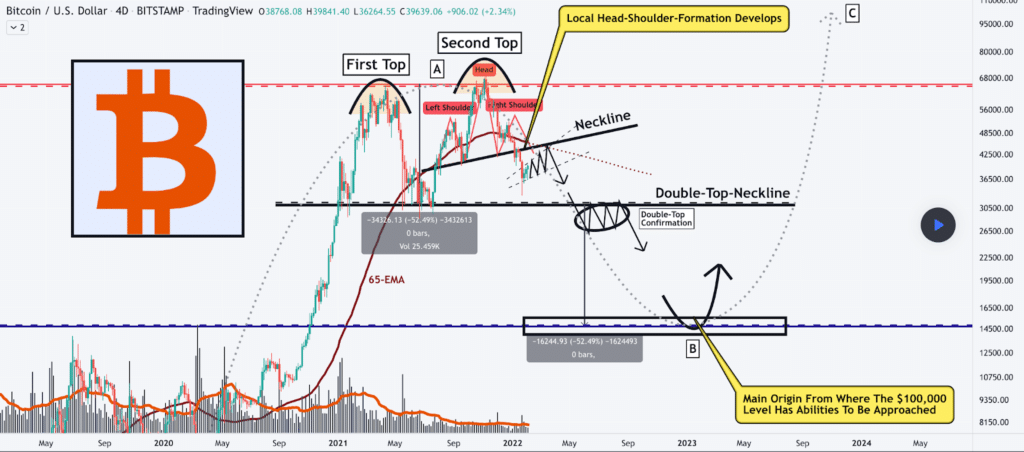
The BTC/USD 4D chart below from VincePrince shows BTC’s price currently following its historical four year cycle trend.
BTC’s price double-topped on the charts on November 10th at $69,044 and had lost more than 50% of its value before this current relief rally. For bullish traders to begin to gain some serious momentum they need to break the neckline to the upside and send BTC’s price back above the $53k level.
If bullish BTC market participants fail to break back above the overhead resistance [neckline] they’ll risk a drop back down to retest the Double-Top-Neckline at the $30k level. If bearish market participants succeed and break that second neckline then much lower prices could be forthcoming on bitcoin mid-term.

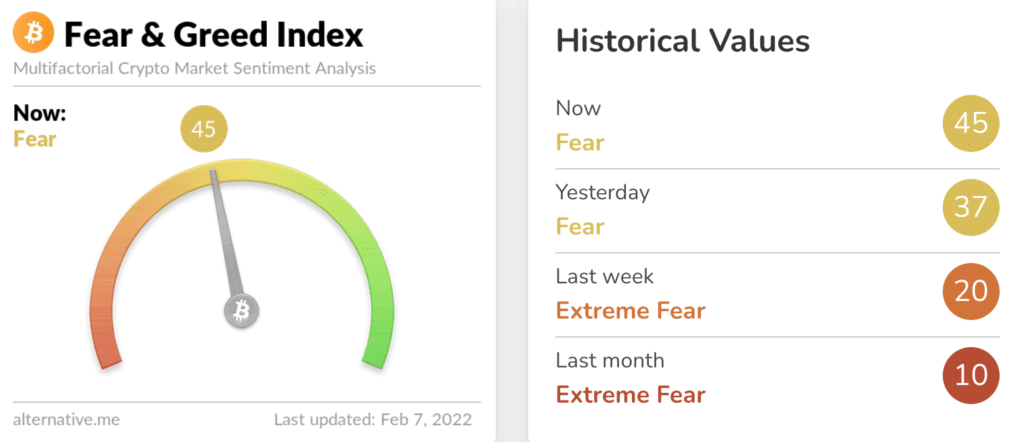
The Fear and Greed Index is 45 Fear and +8 from Sunday’s reading of 37 Fear. Market sentiment has improved over the last week and month overall since The Fear and Greed Index got as low as 10 Extreme Fear last month.

Bitcoin’s Moving Averages: 20-Day [$39,692.61], 50-Day [$45,411.51], 100-Day [$50,993.], 200-Day [$46,159.07], Year to Date [$40,590.39].
BTC’s 24 hour price range is $41,386-$42,526 and its 7 day price range is $36,438-$42,526. Bitcoin’s 52 week price range is $29,341-$69,044.
The price of bitcoin on this date last year was $38,833.
The average price of BTC for the last 30 days is $40,024.
Bitcoin’s price [+2.34%] closed its daily candle session worth $42,423 and in green figures for the ninth time in the last eleven days.
Ethereum Analysis
Ether’s price has finished in green figures for eight of the last nine days and closed its session on Sunday +$42.92.
The ETH/USD 1D chart below from xtremerider8 shows that bullish Ether market participants successfully closed above the 0.618 [$2,915.74] on Sunday and are now shifting their focus to the 0.382 fib level [$3,689.41]. If there’s a successful backtest by bullish traders of the 0.618 and a break of the 0.382, they’ve a secondary target overhead of 0.236 [$4,168.03].
Bullish traders are conversely aiming to retest the 0.618 and break that level again to the downside. If they’re successful they’ve a secondary target below of 0.786 [$2,365] and a third target of 0.854 [$2,142.08].

Ether’s Moving Averages: 20-Day [$2,866.59], 50-Day [$3,549.59], 100-Day [$3,724.95], 200-Day [$3,257.57], Year to Date [$3,003.55].
ETH’s 24 hour price range is $2,980-$3,063 and its 7 day price range is $2,505-$3,063. Ether’s 52 week price range is $1,353-$4,878.
The price of ETH on this date in 2021 was $1,608.
The average price of ETH for the last 30 days is $2,899.
Ether’s price [+1.42%] closed its daily candle on Sunday valued at $3,056.4.
MANA Analysis
Sunday was the fourth consecutive daily session close in green figures for MANA and it finished Sunday’s daily candle +$.28.
The MANA/USD 4HR chart below from davidperkins1 shows MANA’s price currently in a short term uptrend after breaking out above overhead resistance at 0 [$2.9] for a full retracement and is now extending its fib extension levels into the $3+ level.
Mana bulls could see a quick mark-up in price above the $3.4 level with very little overhead resistance above that level on the 4HR chart. For bearish traders to have success again in the short term, they need to again push MANA’s price back under $3 and back into the zone MANA’s price consolidated over the last month between $1.84-$2.9.

MANA’s price is +1,336% against The U.S. Dollar for the last 12 months, +1,286% against BTC, and +714.1% against ETH, at the time of writing.
MANA’s 24 hour price range is $3.06-$3.38 and its 7 day price range is $2.47-$3.38. MANA’s 52 week price range is $1.71-$5.85.
MANA’s price on this date last year was $0.23.
The average price for MANA over the last 30 days is $2.69.
MANA’s price [+9.37%] closed its daily session on Sunday worth $3.29.
Source: https://en.cryptonomist.ch/2022/02/07/bitcoin-42k-ethereum-3k-mana-price-analyses/