Bitcoin Analysis
Bitcoin’s price continued to rally higher on Tuesday and concluded its daily session +$695.8.
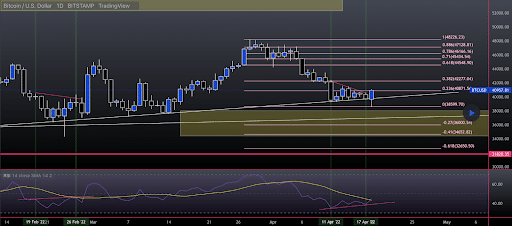
The first chart we’re looking at for Wednesday is the BTC/USD 1D chart below from JacobR905. BTC’s price is trading between the 0.236 fib level [$40,871.56] and 0.382 [$42,277.04], at the time of writing.
The targets overhead for bullish BTC traders are 0.236, 0.382 [$42,277.04] and 0.618 [$44,548.90].
Conversely, bearish traders are aiming to push BTC’s price below 0.236 followed by targets of 0 [$38,599.70] and -0.27 [$36,000.54] to the downside.

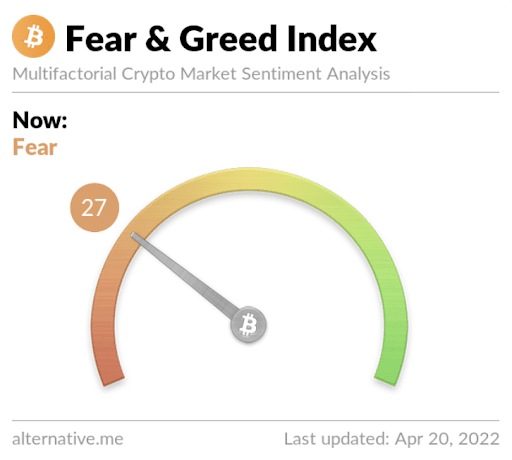
The Fear and Greed Index is 27 Fear and is level with yesterday’s reading of 27.

Bitcoin’s Moving Averages: 5-Day [$40,583.39], 20-Day [$43,508.75], 50-Day [$41,901.71], 100-Day [$43,385.20], 200-Day [$46,747.61], Year to Date [$41,534.21].
BTC’s price is -27.83% against The U.S. Dollar for the last 12 months and -47.3% against ETH over the same time frame.
BTC’s 24 hour price range is $40,645-$41,653 and its 7 day price range is $38,779-$41,653. Bitcoin’s 52 week price range is $29,341-$69,044.
The price of bitcoin on this date last year was $55,721.
The average price of BTC for the last 30 days is $43,251.
Bitcoin’s price [+1.70%] closed its daily candle worth $41,516.8 and in green figures on Tuesday for a second consecutive day.
Ethereum Analysis
Ether’s price also climbed greater than 1% on Tuesday and wrapped up its daily candle +$46.17.
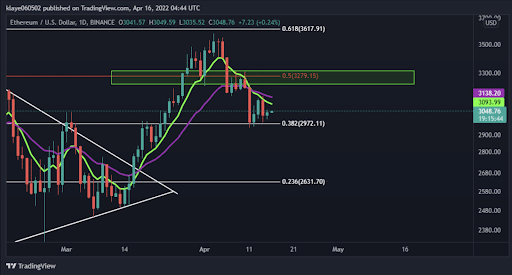
The second chart we’re looking at today is the ETH/USD 1D chart from klaye060502. ETH’s price is trading between the 0.382 fibonacci level [$2,972.11] and 0.5 [$3,279.15], at the time of writing.
The targets overhead for bulls are 0.5 and 0.618 [$3,617.91]. The primary target of bearish traders is 0.382 followed by 0.236 [$2,631.70].
Traders will note that bears have sent ETH’s price below the 0.382 during this pullback but so far have been unable to push ETH’s price below that level with daily candle close confirmation. The lowest daily candle close during this pullback to the $3k level is $2,989.19.

Ether’s Moving Averages: 5-Day [$3,038.57], 20-Day [$3,201.67], 50-Day [$2,959.76], 100-Day [$3,226.55], 200-Day [$3,338.24], Year to Date [$2,978.50].
Ether’s price is +36.94% against The U.S. Dollar for the last 12 months and +89.76% against BTC over the same duration.
ETH’s 24 hour price range is $3,036-$3,125 and its 7 day price range is $2,898-$3,146. Ether’s 52 week price range is $1,719-$4,878.
The price of ETH on this date in 2021 was $2,168.
The average price of ETH for the last 30 days is $3,171.
Ether’s price [+1.51%] closed its daily candle on Tuesday worth $3,101.97 and in green digits for the fourth time in five days.
Apecoin Analysis
Apecoin’s price was up more than 13% at times on Tuesday and APE concluded its daily session +$1.54.
APE is the 39th ranked cryptocurrency project by market capitalization with a market cap of $3.67 billion.
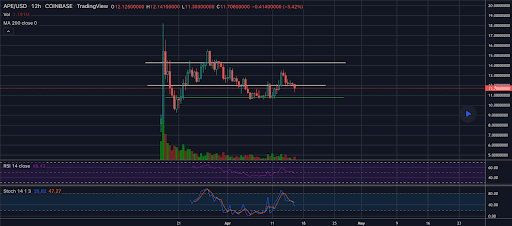
The third chart we’re analyzing for Tuesday is the APE/USD 12HR chart below from KidCrypto514.
The chart shows APE’s price is trading inside a $4 range. APE’s price is potentially consolidating for a larger move to the upside or downside.
APE is +9.26% against The U.S. Dollar for the last 30 days, +11.96% against BTC, and +4.75% against ETH over the same duration, at the time of writing.
Apecoin’s 24 hour price range is $11.73-$13.42 and its 7 day price range is $11.04-13.42. APE’S 52 week range is $9.5-$17.17.
Apecoin’s price [+13.01%] closed its daily candle worth $13.40 and in green figures for the third straight day on Tuesday.
Source: https://en.cryptonomist.ch/2022/04/20/bitcoin-41k-ethereum-3-1k-apecoin-price-analyses/
