Bitcoin Analysis
Bullish Bitcoin market participants broke up two days of selling on Wednesday with a green daily candle and BTC’s price finished its daily session +$108.
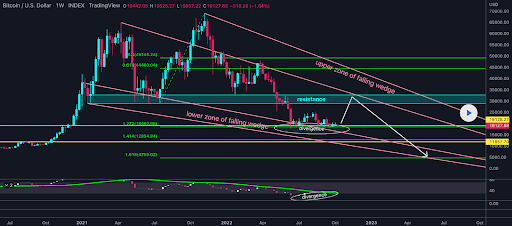
Today we’re starting our price analyses with Bitcoin as always and the BTC/USD 1W chart below from parissap. Bullish BTC traders are trying to hold the 1.272 fibonacci level [$18,492.96], at the time of writing.
We can see below that BTC’s price is trading above the lower zone of its falling wedge with divergence on the Relative Strength Index [RSI]. If the divergence plays out, the chartist posits that BTC’s price could again retest the $30k level and the bottom of the upper zone of its falling wedge.
Bearish Bitcoin traders are conversely trying to invalidate the bullish divergence on the RSI and send BTC’s price below the 1.272 fibonacci level. The bearish targets below that level are 1.414 [$12,854.84] and 1.618 [$4,755.02].
The Fear and Greed Index is 20 Extreme Fear and is equal to Wednesday’s reading.

Bitcoin’s Moving Averages: 5-Day [$19,388.14], 20-Day [$19,434.27], 50-Day [$20,765.58], 100-Day [$22,145.38], 200-Day [$30,844.84], Year to Date [$31,058.52].
BTC’s 24 hour price range is $19,025-$19,233 and its 7 day price range is $18,937.89-$20,420.51. Bitcoin’s 52 week price range is $17,611-$69,044.
The price of Bitcoin on this date last year was $57,381.
The average price of BTC for the last 30 days is $19,625.4 and its -11.75 over the same stretch.
Bitcoin’s price [+0.50%] closed its daily candle worth $19,158 and in green figures on Wednesday.
Ethereum Analysis
Ether’s price also closed Wednesday’s daily candle in green figures for the first time in three days and ETH’s price finished the day +$14.61.
The ETH/USD 12HR chart by cryptovatsik is the second chart we’re looking at for this Thursday. ETH’s price is trading between the 78.60% fib level [$1,125.39] and 61.80% fib level [$1,318.08], at the time of writing.
The overhead targets on ETH for bullish market participants are 61.80%, 50.00% [$1,453.42], 38.20% [$1,588.76], 23.60% [$1,756.22], and a full retracement to the level where ETH’s price recently suffered its breakdown at 0.00% [$2,026.90].
Ether’s Moving Averages: 5-Day [$1,315.87], 20-Day [$1,343.12], 50-Day [$1,552.69], 100-Day [$1,486.64], 200-Day [$2,155.18], Year to Date [$2,178.09].
ETH’s 24 hour price range is $1,275.25-$1,306.87 and its 7 day price range is $1,275.25-$1,383.46. Ether’s 52 week price range is $883.62-$4,878.
The price of ETH on this date in 2021 was $3,607.21.
The average price of ETH for the last 30 days is $1,377.99 and its -27.06% over the same stretch.
Ether’s price [+1.14%] closed its daily candle on Wednesday valued at $1,294.57.
Tron Analysis
Tron’s price has been the strongest performer of the lot covered today for many consecutive weeks now and TRX’s price was +$0.00006 when traders settled-up on Wednesday.
The final project for analysis today is Tron and the TRX/USD 1D chart below from sparker1987. TRX’s price is trading between the 1 fib level [$0.0637] and 0.786 [$0.0662], at the time of writing.
Tron’s bullish market participants are seeking to reclaim the 0.786 fib level followed by targets of 0.618 [$0.068], 0.5 [$0.069], 0.382 [$0.071], 0.236 [$0.072], and 0 [$0.075].
If those shorting TRX are going to inflict further damage on bullish dreams, they need to send TRX’s price below the 1 fib level and then retest the 1.618 [$0.056].
TRX’s price is -33.16% against The U.S. Dollar over the last 12 months, +94.08% against BTC, and +78.62% against ETH.
Tron’s Moving Averages: 5-Day [$0.062], 20-Day [$0.061], 50-Day [$0.063], 100-Day [$0.066], 200-Day [$0.066], Year to Date [$0.066].
Tron’s 24 hour price range is $0.061-$0.064 and its 7 day price range is $0.061-$0.064. TRX’s 52 week price range is $0.04707-$0.12909.
Tron’s price on this date last year was $0.09793.
The average price of TRX over the last 30 days is $0.061 and its -4.4% over the same time frame.
Tron’s price [+0.10%] closed the daily time frame on Wednesday worth $0.061 and in green digits for the third time in four days.
Source: https://en.cryptonomist.ch/2022/10/13/bitcoin-ethereum-tron-wednesday-green/


