Bitcoin Analysis
When traders settled up at the close of Sunday’s daily candle BTC’s price was -$503 for its daily session.
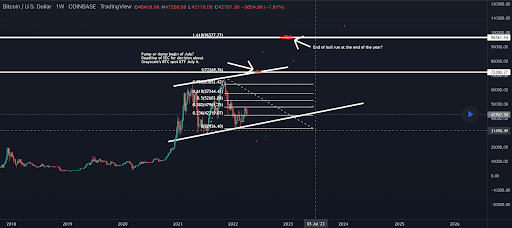
The first chart we’re analyzing today is the BTC/USD 1W chart below from goerh. BTC’s price closed the weekly timescale trading between the 0.236 [$42,219.07] fibonacci level and 0.382 [$47,961.75] on the 1W time frame.
Overhead targets for bullish traders are 0.382, 0.5 [$52,603.08] and 0.618 [$57,244.42]. The targets to the downside for bearish BTC traders are 0.236 [$42,219.07] and 0 [$32,936.4].
The Fear and Greed Index is 32 Fear and is -2 from Monday’s reading of 34 Fear.

Bitcoin’s Moving Averages: 5-Day [$44,480.5], 20-Day [$43,678.94], 50-Day [$41,856.31], 100-Day [$44,559.06], 200-Day [$46,506.27], Year to Date [$41,654.89].
BTC’s 24 hour price range is $42,466-$43,308 and its 7 day price range is $42,273-$46,923. Bitcoin’s 52 week price range is $29,341-$69,044.
The price of bitcoin on this date last year was $59,979.
The average price of BTC for the last 30 days is $43,116.
Bitcoin’s price [-1.40%] closed its daily candle worth $42,780 and in red figures on Sunday.
Ethereum Analysis
Ether’s price also traded lower when it closed its daily session on Sunday than when it opened it and concluded its daily session -$58.39.
The ETH/USD 1D chart below by SGDKHOR shows Ether’s price trading between the 0.382 fib level [$3,194.44] and 0.5 [$3,514.17].
Bullish Ether market participants are targeting the 0.5 fib level followed by 0.618 [$3,833.9] and thirdly 0.786 [$4,289.12].
Bearish Ether market participants have targets below of 0.382, 0.236 [$2,798.83], and 0 [$2,159.37].
Ether’s Moving Averages: 5-Day [$3,334.95], 20-Day [$3,122.87], 50-Day [$2,936.58], 100-Day [$3,318.3], 200-Day [$3,308.04], Year to Date [$2,973.88].
ETH’s 24 hour price range is $3,228-$3,306 and its 7 day price range is $3,149-$3,559. Ether’s 52 week price range is $1,719-$4,878.
The price of ETH on this date in 2021 was $2,142.8.
The average price of ETH for the last 30 days is $3,069.92.
Ether’s price [-1.79%] closed its daily candle on Sunday worth 3,201.61.
Fantom Analysis
Fantom’s price also traded in red digits on Sunday and concluded its daily candle -$0.044. FTM’s price has finished in red figures for five of the last seven days.
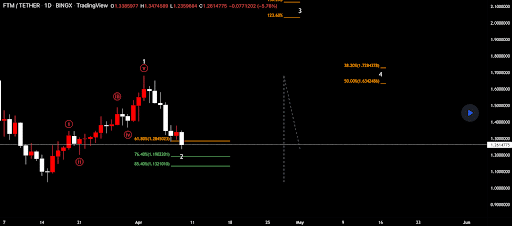
The FTM/USD 1D chart below from Kennethtoots shows Fantom’s price attempting to cling to the 61.80% fib level [$1.28], at the time of writing.
The targets to the upside for short-term optimists on FTM’s price are 50.00% [$1.63] and 38.20% [$1.72].
Conversely, the targets for bearish FTM market participants are 61.80%, 76.40% [$1.19], and 85.40% [$1.13].
Fantom’s price is +199.8% against The U.S. Dollar for the last 12 months, +314.5% against BTC, and +94.91% against ETH over the same duration, at the time of writing.
Fantom’s 24 hour price range is $1.26-$1.3 and its 7 day price range is $1.25-$1.63. FTM’s 52 week price range is $0.153-$3.46.
Fantom’s price on this date last year was $0.44.
The average price of FTM over the last 30 days is $1.32.
Fantom’s price [-3.42%] was worth $1.25 on Sunday when its daily candle closed.
Source: https://en.cryptonomist.ch/2022/04/11/bitcoin-42k-ethereum-3-2k-fantom-price-analyses/


