Bitcoin Analysis
Bitcoin’s price dipped lower on Monday and finished the new week’s first daily candle -$869.
The BTC/USD 4HR chart below from DavidJDM shows bearish BTC traders pushing BTC’s price lower after taking BTC’s price back below the 0.236 fib level [$48,638.45]. The next level of support is a full retracement back to the 0 fib level [$42,343.13].

The bearish pursuit of the $42k level also marks a return to test the lowest price [$46,328] on BTC since its all-time high [$69,044] was made on November 10th, 2021.
Bitcoin’s Moving Averages: 20-Day [$48,475.79], 50-Day [$55,359.85], 100-Day [$52,724.84], 200-Day [$48,207.84].
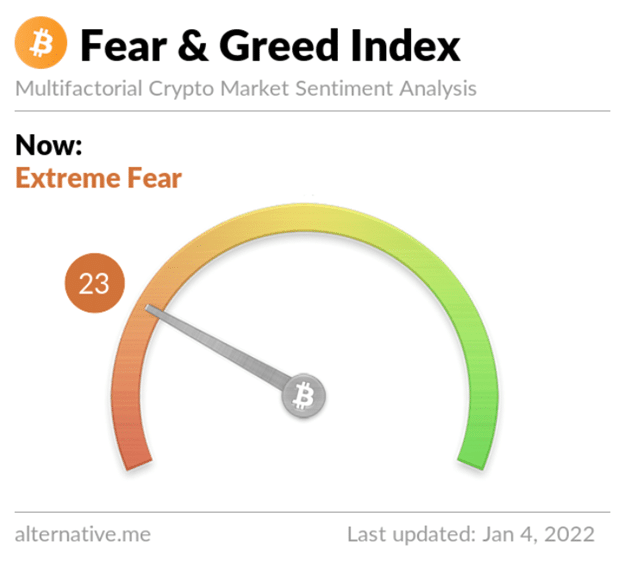
The Fear and Greed Index is 23 Extreme Fear and -6 from yesterday’s reading of 29 Fear.

BTC’s 24 hour price range is $45,810-$47,568 and its 7 day price range is $45,810-$50,774. Bitcoin’s 52 week price range is $28,991-$64,044.
The price of bitcoin on this date last year was $33,008.
The average price of BTC for the last 30 days is $48,425.
Bitcoin [-1.84%] closed its daily candle worth $46,445 and in red figures for a second straight day.
Ethereum Analysis
Ether’s price also sold off more than 1% on Monday and finished its daily candle -$66.76.
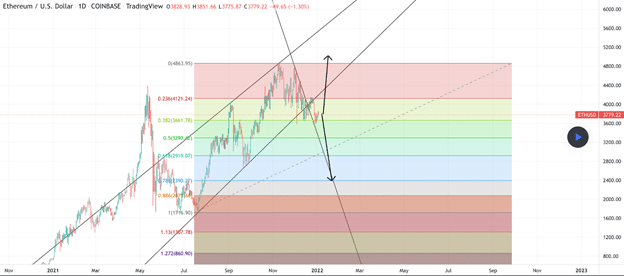
Today’s analysis is of the ETH/USD 1D chart from DavidJDM and we’re trying to posit the probability of ETH’s next move based on some important fibonacci levels.
Traders will note that after bearish Ether traders cracked the 0.236 fib level [$4,121.24] that the next line of defense is the 0.382 fib [$3,661.78]. Ether bulls are clinging to support at that level and if they fail to hold the 0.382 fib then the next stop is below the $3k level at 0.618 [$2,919.07].

If bullish traders want to get back on track, they’ll first need to reclaim the 0.236 fib level. If that level is reclaimed by bulls it would put Ether’s price back in the ascending channel it traded in [or above] for nearly all of 2021.
Ether’s Moving Averages: 20-Day [$3,971.53], 50-Day [$4,233.05], 100-Day [$3,826.28], 200-Day [$3,175.17].
ETH’s 24 hour price range is $3,695-$3,856 and its 7 day price range is $3,622-$4,034. Ether’s 52 week price range is $984.99-$4,878.
The price of ETH on this date in 2020 was $1,103.
The average price of ETH for the last 30 days is $3,975.
Ether [-1.74%] closed its daily candle on Monday worth $3,764 and broke a streak of two straight daily closes in green figures.
Aave Analysis
AAVE’s price action on Monday was mostly static but finished +$1.30 for its daily candle.
The AAVE/USD 4HR chart below from Rex_yang shows that AAVE’s price has broken out of its falling wedge and is currently trying to test the 1 fib level [$296.8]. If bullish AAVE traders can reclaim the $296 level then the next overhead fib resistance is at 1.272 [$334.7].

If bearish AAVE traders hope to stall AAVE’s bullish momentum then they need to pivot soon and send the price below 0.618 again and to test the 0.5 fib level [$227.2].
AAVE’s price is +196.7% for the last 12 months against The U.S. Dollar, +108.1% against BTC, and -26.1% against ETH over the same time frame.
AAVE’S 24 hour price range is $264.31-$285.36 and its 7 day price range is $233.57-$294.74. AAVE’s 52 week price range is $99.9-$661.69.
AAVE’s price on this date last year was $109.58.
The average price for AAVE over the last 30 days is $215.19.
AAVE [+0.49%] closed its daily candle on Monday worth $266.6 and in green digits again after closing Sunday’s candle in red digits.
Source: https://en.cryptonomist.ch/2022/01/04/bitcoin-ethereum-aave-price-analyses/