- Bitcoin’s dominance rises with a 1.33% surge, impacting market sentiment.
- Ethereum’s technical indicators show a potential bearish trend.
- Kaito sees a remarkable 41.47% daily increase, indicating bullish momentum.


Bitcoin’s recovery gains momentum, breaking past key resistance at $88,765, while KAITO climbs parabolically, and Ethereum pauses in its downtrend, setting the stage for notable market shifts.
Bitcoin’s bullish breakout above $88,765 signals potential continuation towards $109,588 if $99,475 resistance breaks. KAITO’s rally stalls near $1.40 on buying exhaustion, and Ethereum’s consolidation suggests impending directional move amid volume tapering.
Bitcoin Gains 1.33% Amid Rising Market Dominance
Bitcoin’s recent 1.33% surge to $96,170.82 is driven by high trading volume at $62,629,130,226. Its market cap reaches $1,910,098,703,926, showing dominance at 64.32% and a 7-day gain of 2.14%.
Technical indicators show mixed signals: SMA is below short, medium, and long-term averages, while RSI at 66.48 hints bearish. The MACD at 2,771.98 suggests bearish momentum, with StochRSI indicating bullish sentiment.
Bitcoin (BTC) Technical Analysis
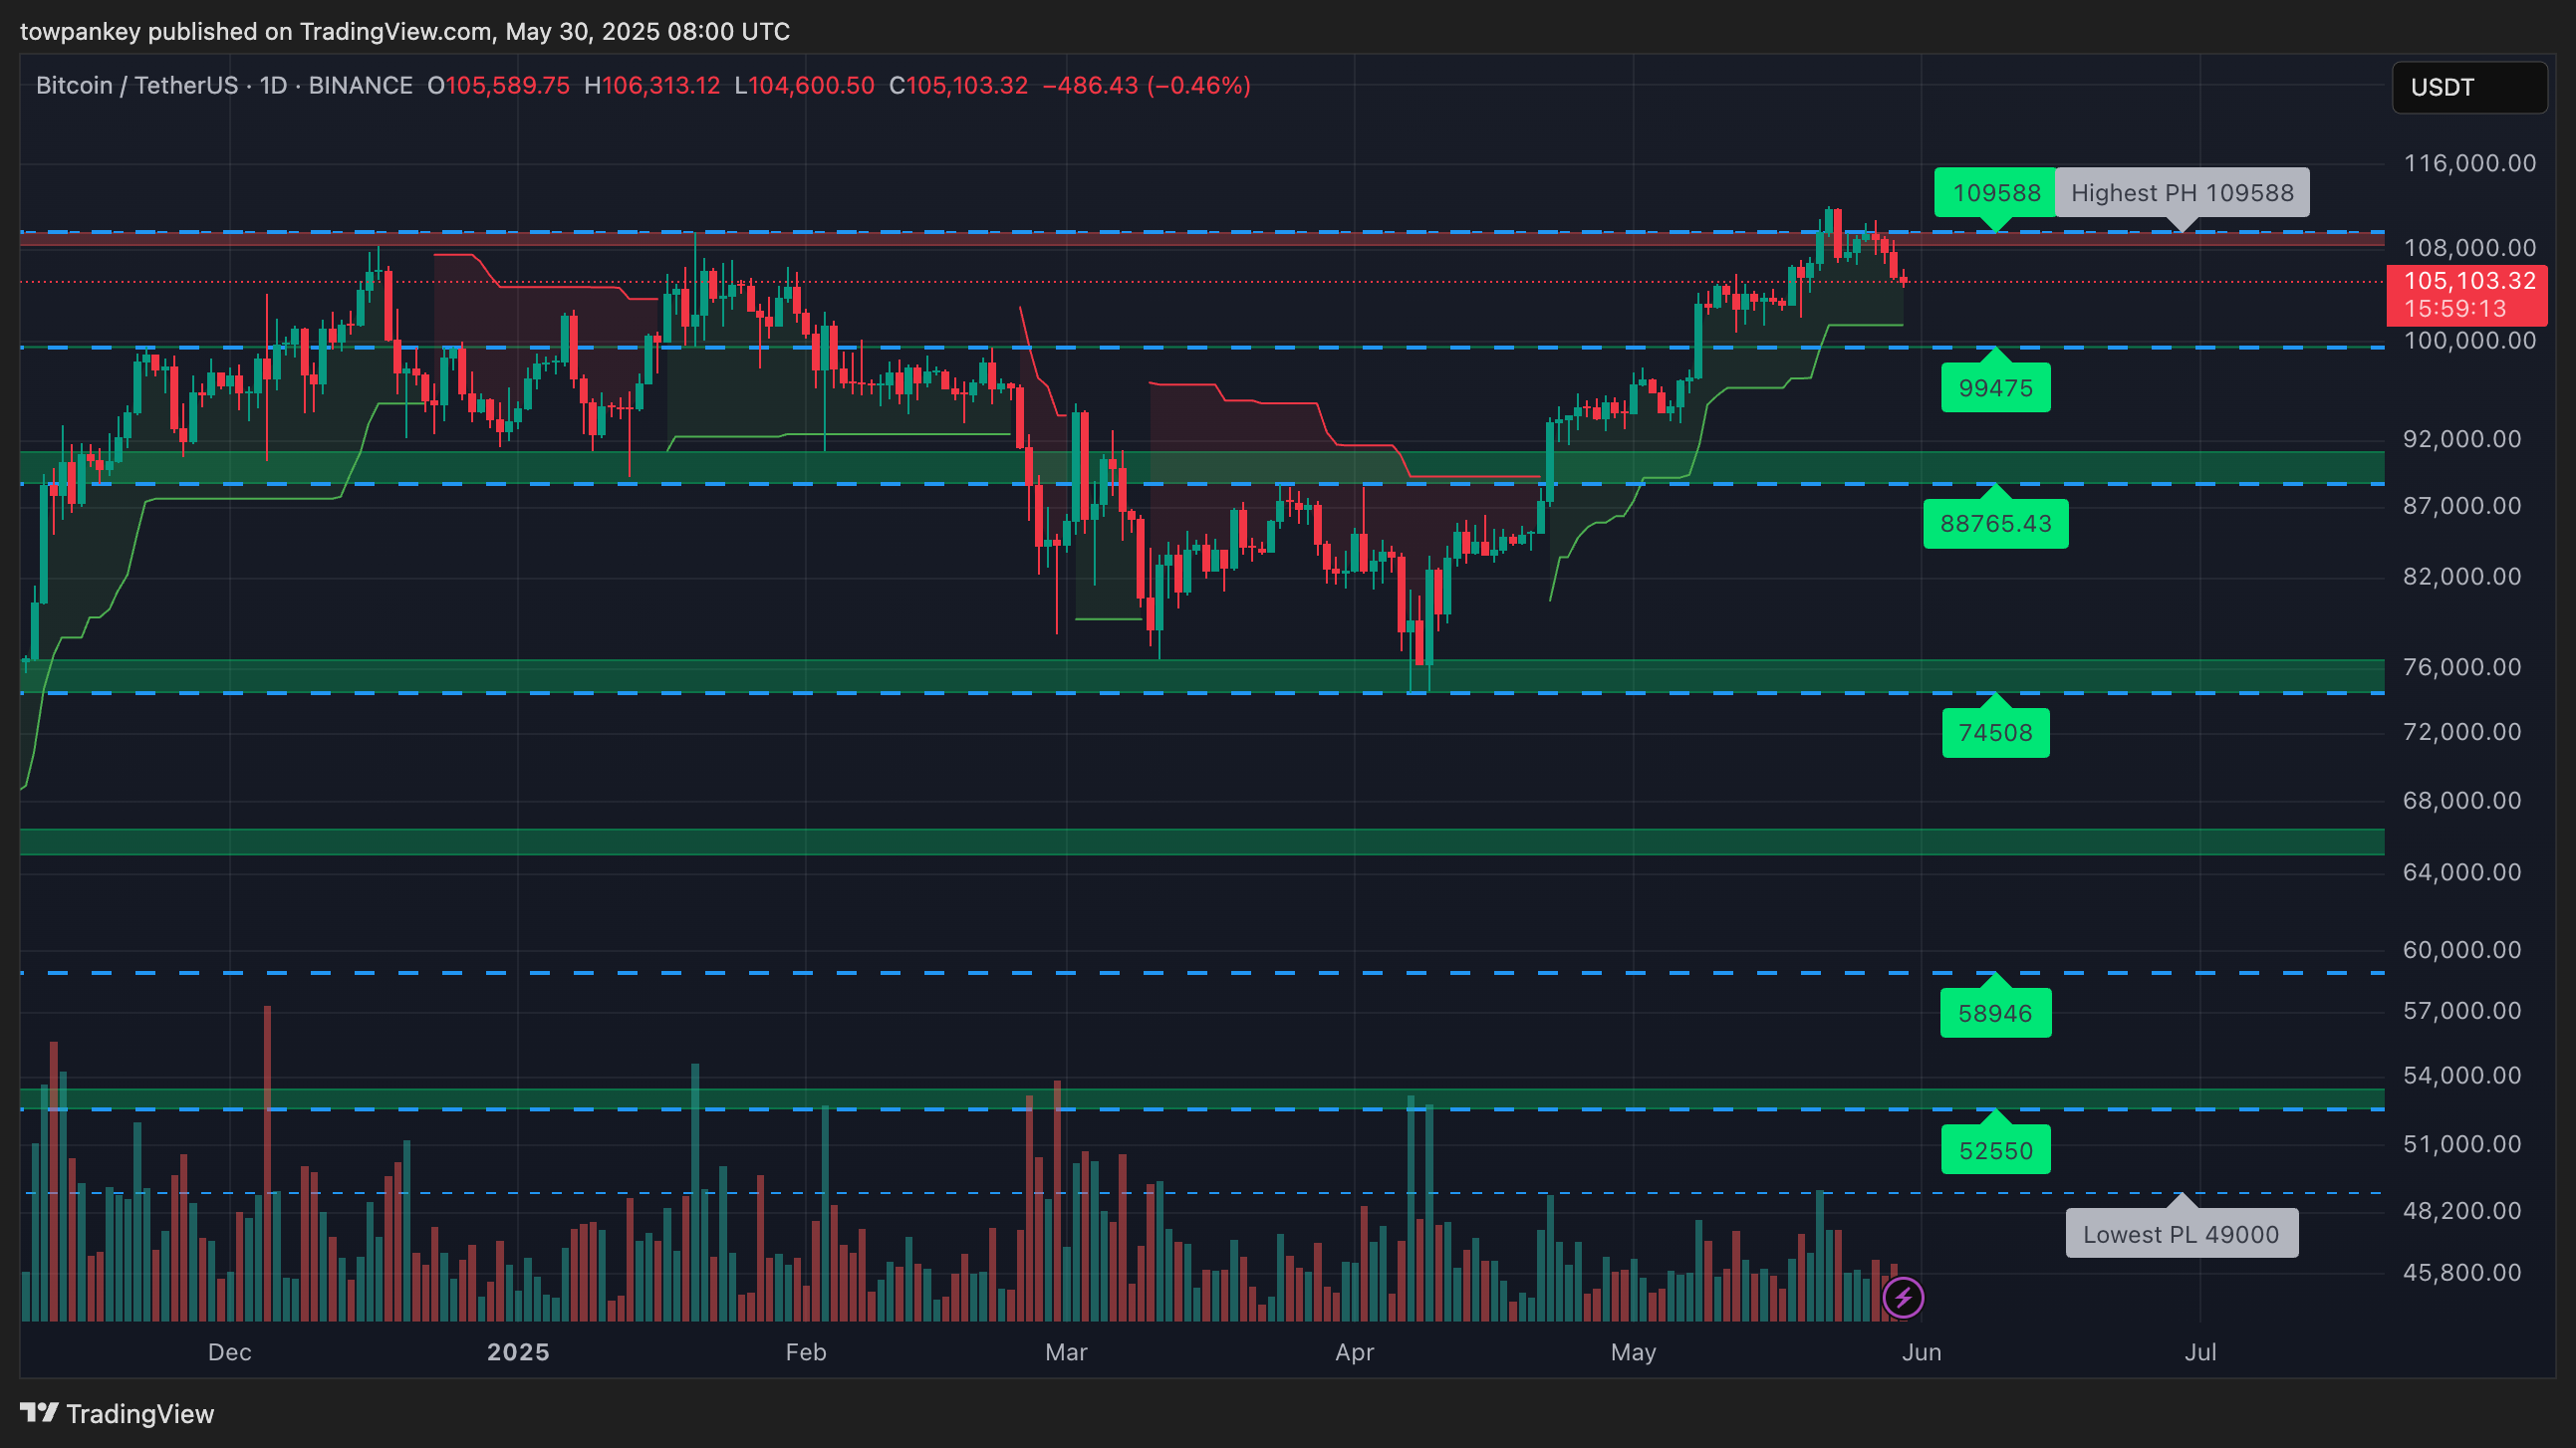
The macro structure on the daily BTC/USDT chart shows a recovery from a mid-March bottom near $74,500. Price has since formed a consistent uptrend, establishing higher lows and recently breaking above the previous key resistance around $88,765.43.
The market is currently approaching a well-marked resistance zone at $99,475, just below the local high of $109,588. This indicates the market is transitioning from accumulation into a possible markup phase. The structure suggests a bullish continuation unless price rejects heavily at current levels.
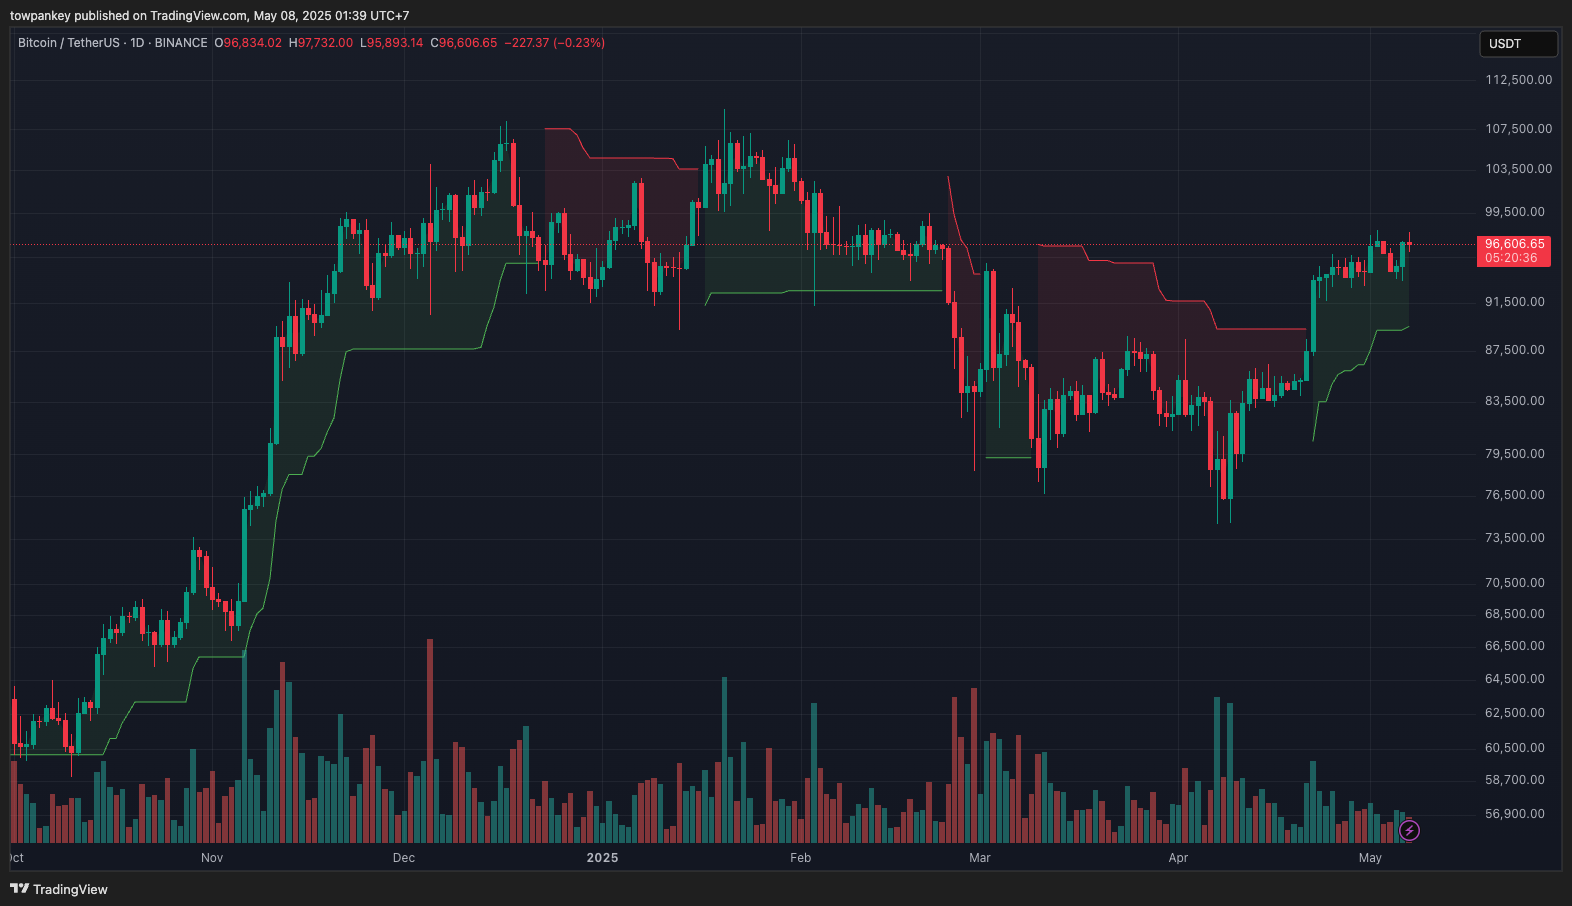

Recent candles near the $96,000–$97,000 range show hesitation, with smaller bodies and upper shadows forming under resistance. This is often indicative of supply entering the market. However, volume remains relatively stable without a major spike in selling pressure.
The bullish breakout on April 25 from the $88,765 resistance was accompanied by strong volume, validating the move. The lack of aggressive sell volume since then suggests buyers still control the momentum, albeit cautiously.

Bitcoin Price Action Scenarios
- Bullish: If price breaks and closes above $99,475, it may target $109,588 (previous high) or higher levels.
- Bearish:If support at $88,765 breaks, expect a potential drop to the next major demand zone at $74,508.
- Neutral: Sideways consolidation likely if volume weakens and price hovers between $88,765 – $99,475.
Read more: Bitcoin (BTC) Price Prediction Tomorrow and Next Week
Ethereum Signals Bearish Trends Despite Neutral Momentum
Ethereum (ETH) is trending, showing a 24-hour change of 1.32% and trading at $1,800.15. Its trading volume reached $39,045,753,592, with a dominance of 7.32% and a weekly gain of 0.87%. Current momentum is neutral.
ETH’s RSI at 55.34 and MACD at 22.13 indicate bearish trends, while CCI remains neutral at 55.56. With ADX at 16.04 and StochRSI at 50.25, support is elusive, targeting upside potential.
Ethereum (ETH) Technical Analysis
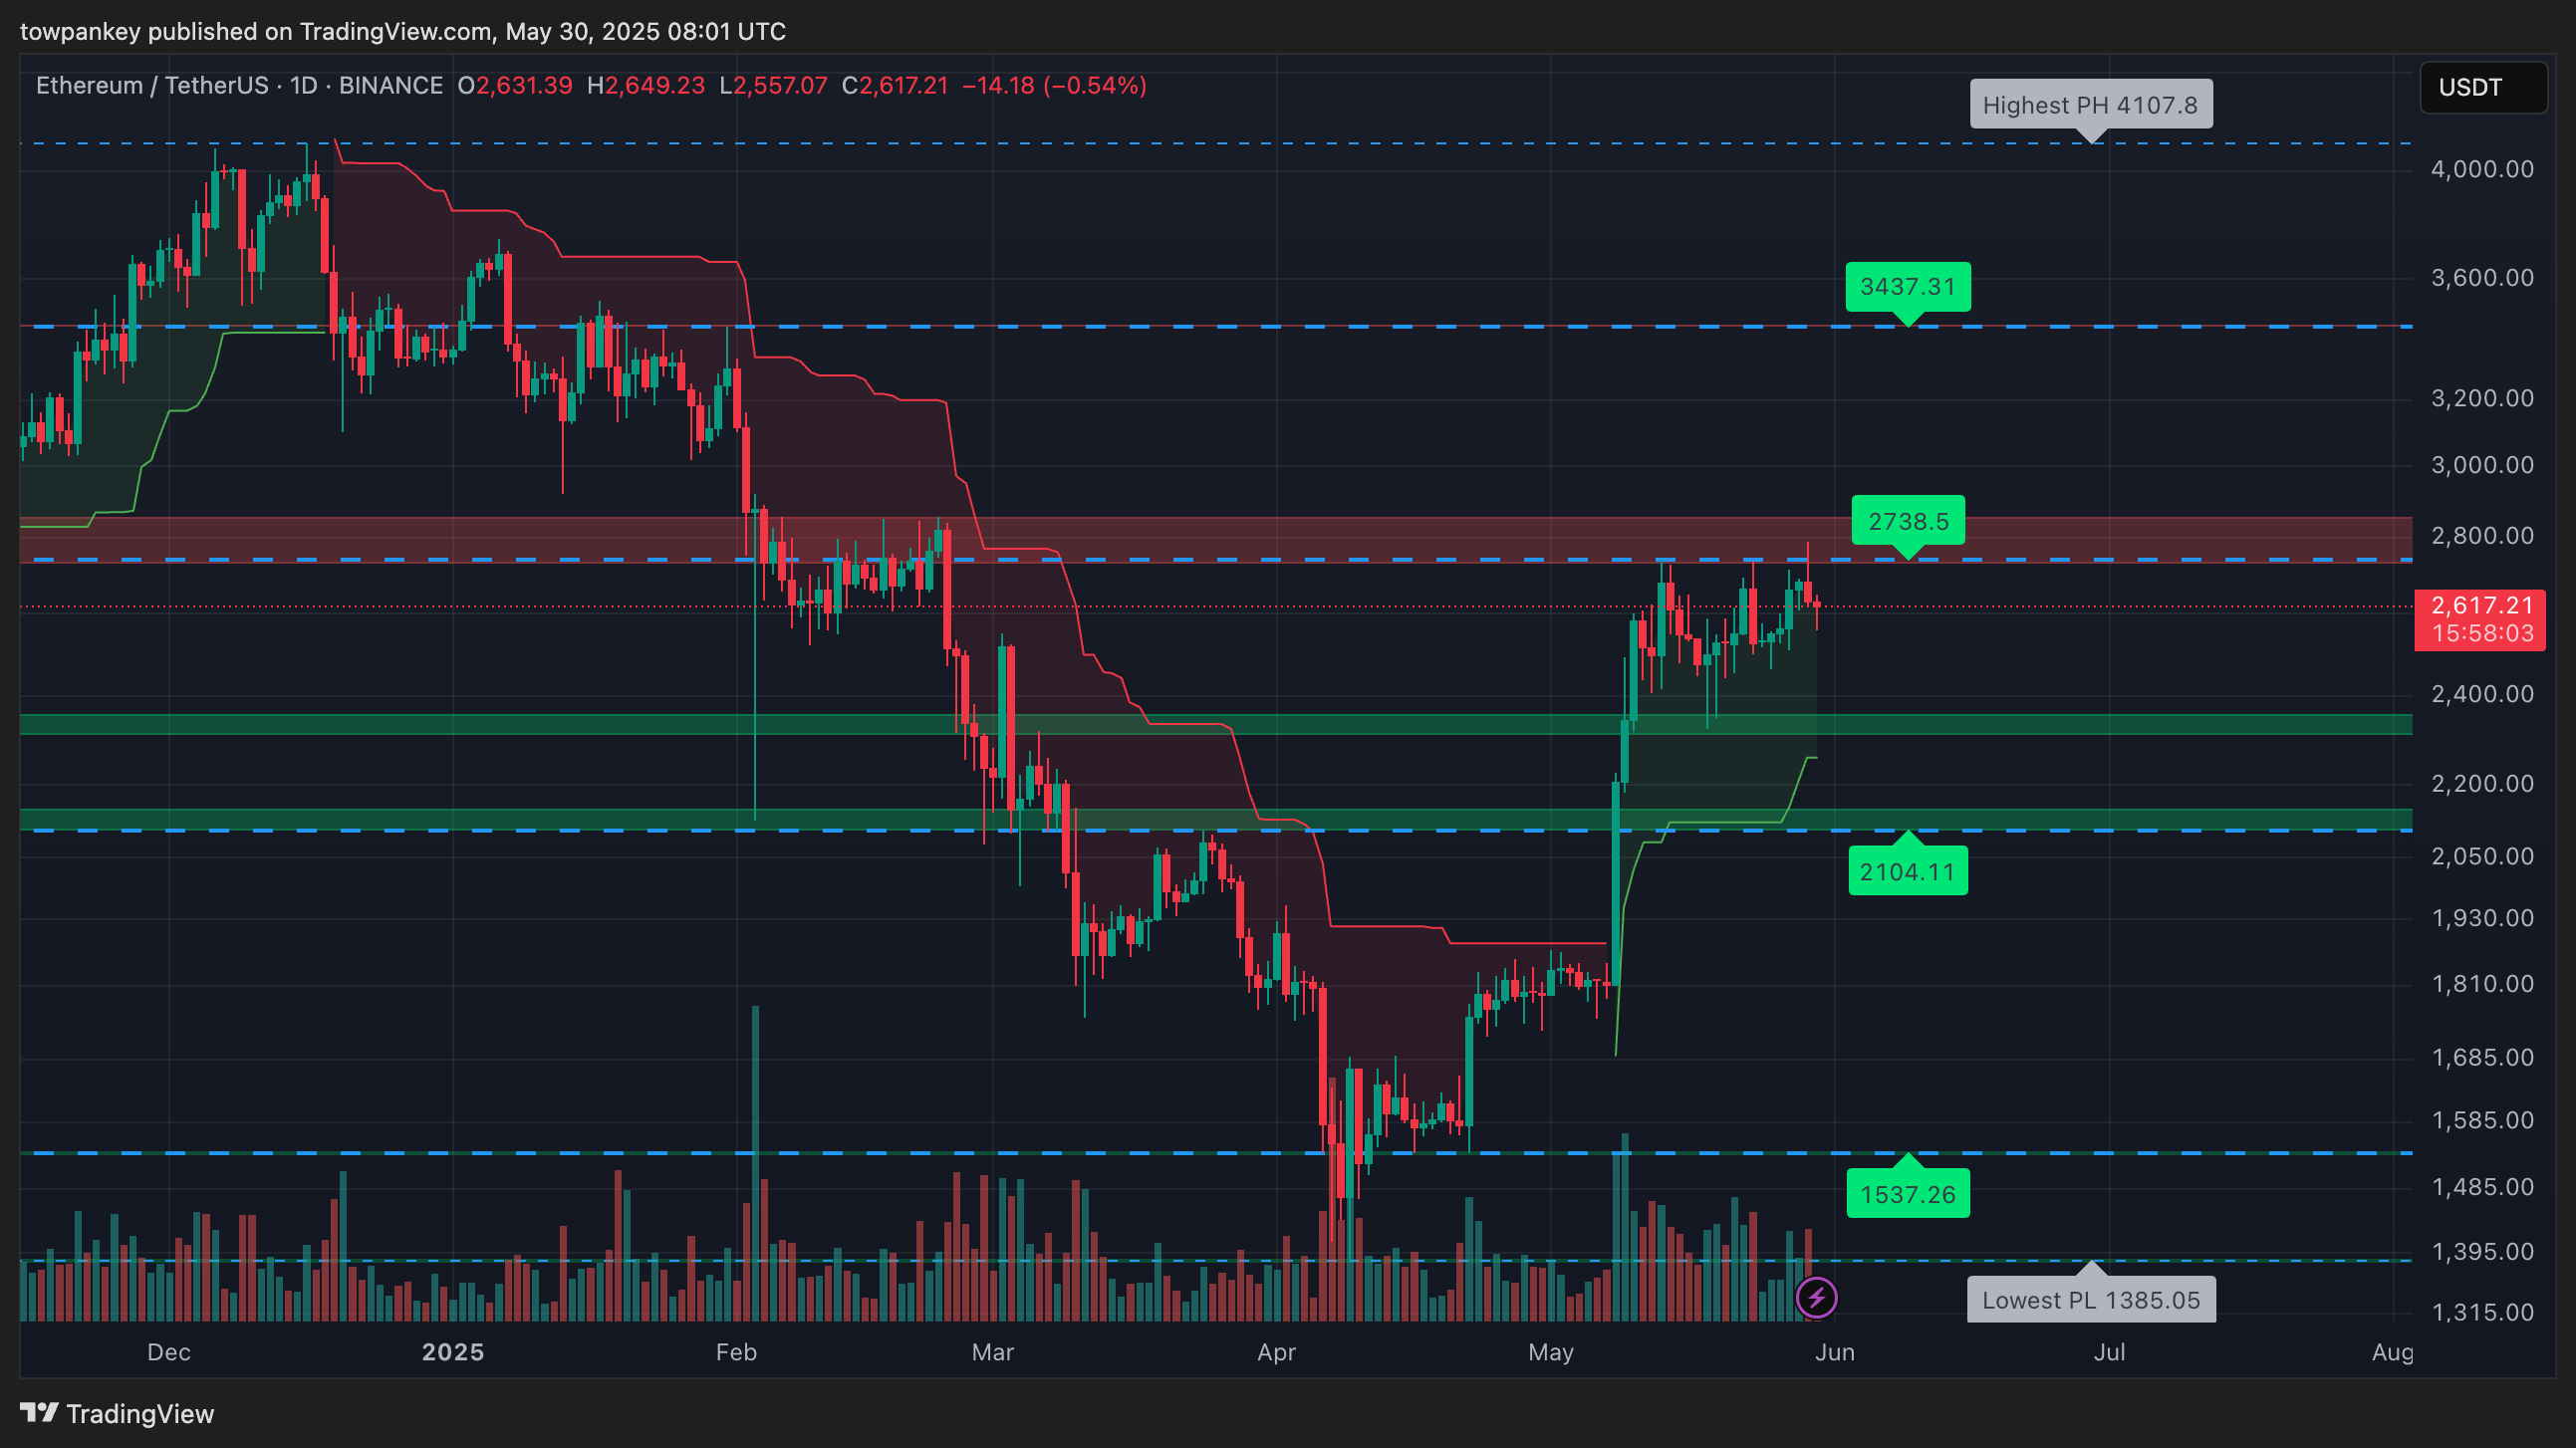
Ethereum remains in a mid-term downtrend, with a series of lower highs and lower lows since peaking near $3,437. After forming a local bottom at $1,385 in early April, price has rebounded modestly and is now consolidating just below the $1,860 zone.
The range sits between a former key support level ($1,860) now acting as resistance, and a new higher low forming above $1,537. Price has not yet confirmed a trend reversal, but rather a pause in the downtrend with early signs of base building.
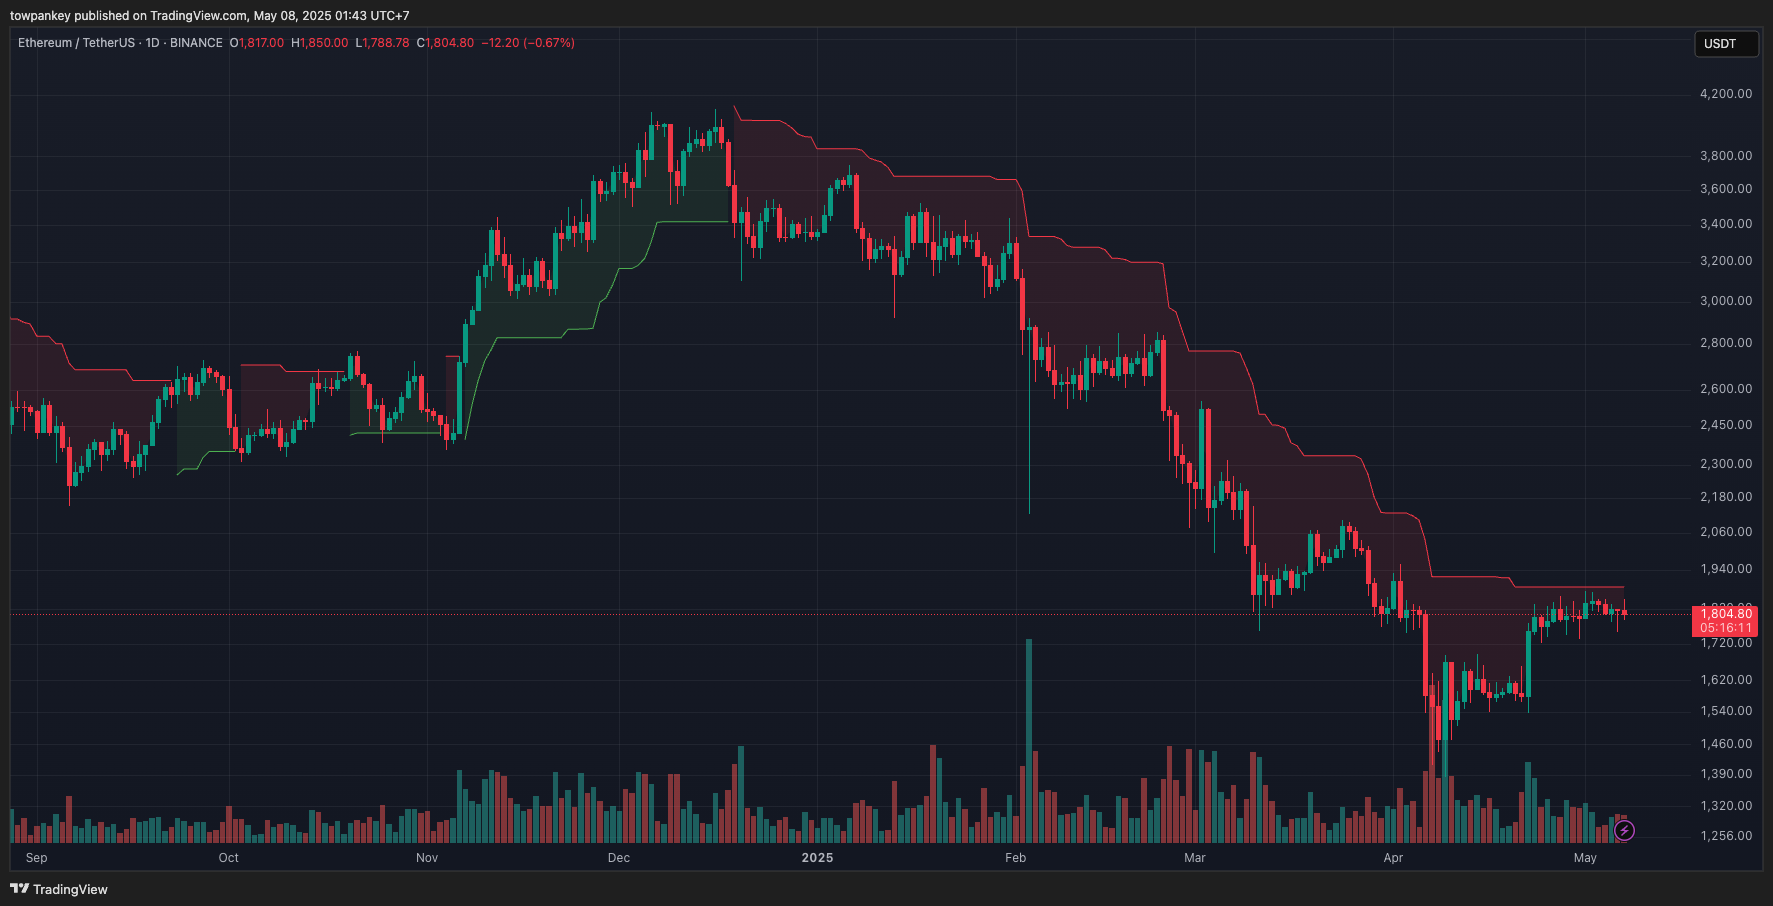

Recent candlesticks show tight-bodied consolidation around $1,800–$1,860 with small wicks, indicating indecision and equilibrium between buyers and sellers.
Volume is tapering off slightly, suggesting exhaustion from both bulls and bears after the recent bounce. This type of price behavior often precedes a breakout or breakdown, depending on which side regains initiative.

Ethereum Price Action Scenarios
- Bullish: If price breaks and holds above $1,860, watch for a move to $2,104, and potentially toward $2,857.
- Bearish:Breakdown below $1,537 could send ETH toward $1,385 and even retest lower lows.
- Neutral: Continued chop likely between $1,537 – $1,860 unless volume and momentum reappear.
Read more: Ethereum (ETH) Price Prediction Tomorrow and Next Week
Kaito Jumps 41.47% in 24-Hour Bullish Surge
KAITO is trending with a 24-hour price gain of 41.47%, reaching $1.29. Its trading volume surged by 624.60% to $733,224,805.05. The short-term sentiment is bullish, boosted by positive MACD and a recent 7-day performance of 53.58%.
Technicals show RSI and MFI in overbought zones. StochRSI suggests possible divergence as SMA (10-200) remains bullish. The ADX indicates strong trend continuation, yet signs of possible trend exhaustion emerge amidst elevated trading volumes.
Read more: KAITO (KAITO) Price Prediction Tomorrow and Next Week
KAITO (KAITO) Technical Analysis
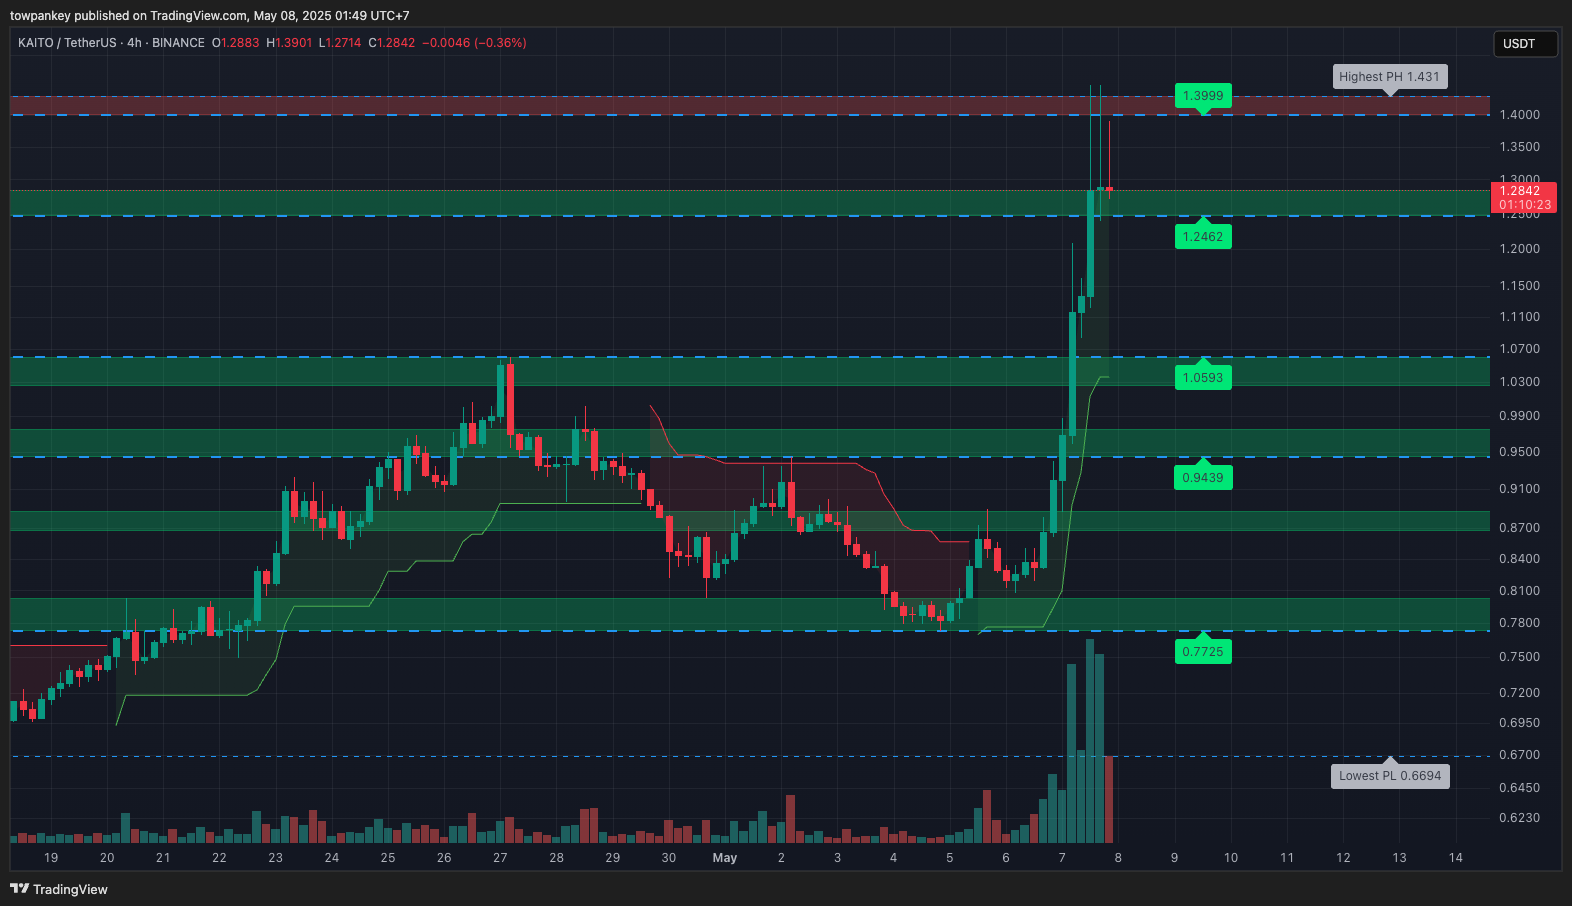
KAITO is in a strong short-term uptrend, having just broken out of multiple resistance zones in quick succession. After consolidating between $0.77 and $0.95 for several days, price surged with high momentum, smashing through $1.0593 and $1.2462 before peaking near $1.3999.
This move marks a parabolic leg, often seen in explosive altcoin rallies. However, current price has pulled back slightly from its local high, suggesting a cooling-off phase or short-term profit-taking.
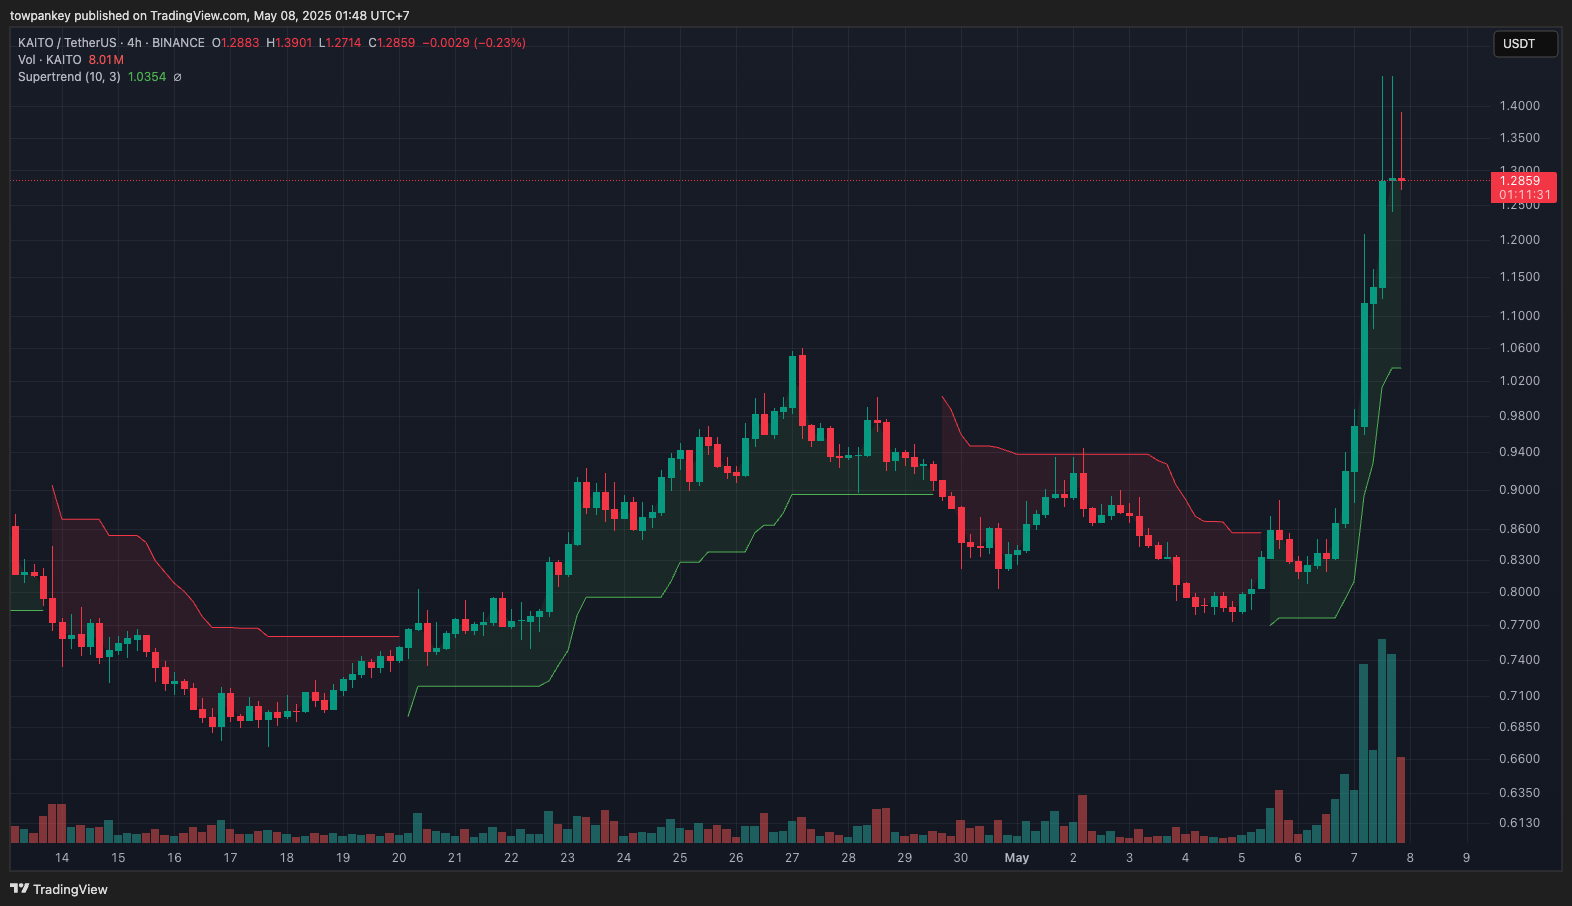

The breakout candle that launched price through $1.0593 to above $1.2462 was large-bodied and accompanied by very high volume, indicating institutional or whale participation.
However, the most recent candle shows a long upper shadow and decreasing volume, suggesting buying exhaustion or a local top near $1.40. Watch for further wick rejections in this zone to confirm resistance.

KAITO Price Action Scenarios
- Bullish: Break above $1.3999 could lead to a run toward $1.431 and possibly initiate price discovery.
- Bearish:If price falls below $1.2462, it could revisit the support at $1.0593 or even dip to $0.9439.
- Neutral: Price may consolidate between $1.2462 – $1.3999 as it digests recent gains and builds structure.
| DISCLAIMER: The information on this website is provided as general market commentary and does not constitute investment advice. We encourage you to do your own research before investing. |
Source: https://coincu.com/336218-bitcoin-climbs-kaito-hits-1-29-eth-still-rangebound/