Bitcoin Analysis
Bitcoin’s price finished in green figures by less than 1% on Monday and concluded its daily session +$228.1.
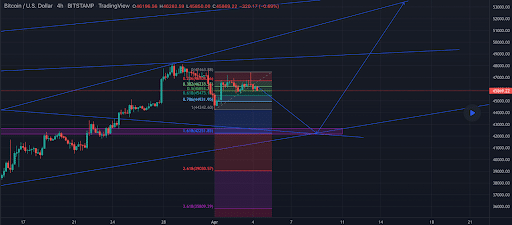
The first chart we’re looking at today is the BTC/USD 4HR chart below from industradingstore. BTC’s price is trading between the 0.382 fibonacci level and 0.236 [$46,703.16], at the time of writing.
To avoid a reversal to the downside, bullish BTC traders need to finally breach the 0 [$47,463.88] level followed by candle close confirmation on significant timescales.
Bearish traders have their sights set on 0.5 [$45,853.20], 0.618 [$45,473.15], and 0.786 [$44,931.95].
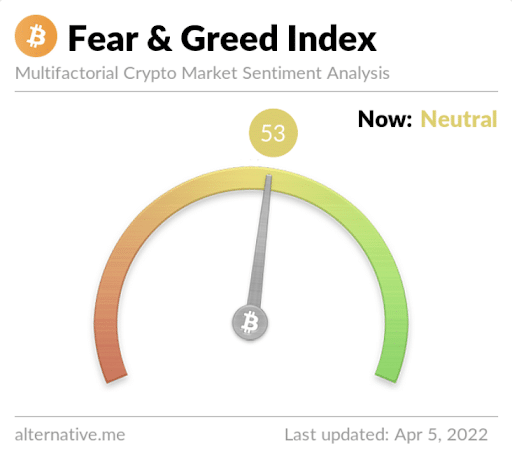
The Fear and Greed Index is 53 Neutral and is +1 from Monday’s reading of 52 Neutral.

Bitcoin’s Moving Averages: 5-Day [$46,559.87], 20-Day [$42,792.92], 50-Day [$41,270.03], 100-Day [$45,156.71], 200-Day [$46,311.21], Year to Date [$41,508.32].
BTC’s 24 hour price range is $45,277-$47,322 and its 7 day price range is $44,347-$47,884. Bitcoin’s 52 week price range is $29,341-$69,044.
The price of bitcoin on this date last year was $58,228.
The average price of BTC for the last 30 days is $42,330.
Bitcoin’s price [0.49%] closed its daily candle worth $46,611.1 and in green figures for a second consecutive day on Monday.
Ethereum Analysis
Ether’s price didn’t catch the late session bids that BTC’s price caught on Monday and concluded its daily session -$0.74.
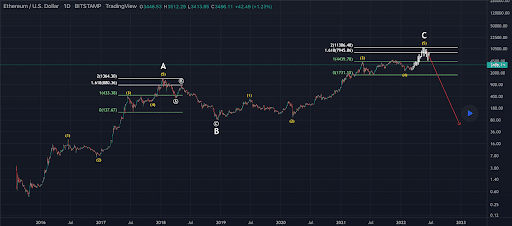
The ETH/USD 1D chart below by illuminati_K027 shows Ether’s price trading between the 0 fibonacci level [$1,731.15] and 1 [$4,439.78], at the time of writing.
Bullish Ether market participants are eyeing a return to retest the $4,5k level if they can breach psychological resistance at $4k.
From the perspective of bearish traders, they’ll be encouraged if they can again send ETH’s price below the $3k level with an eventual target of $1,731.15 to the downside.
ETH’s 24 hour price range is $3,424-$3,573 and its 7 day price range is $3,220-$3,573. Ether’s 52 week price range is $1,719-$4,878.
Ether’s Moving Averages: 5-Day [$3,404.61], 20-Day [$2,984.79], 50-Day [$2,867.03], 100-Day [$3,354.40], 200-Day [$3,285.20], Year to Date [$2,954.05].
The price of ETH on this date in 2021 was $2,077.76.
The average price of ETH for the last 30 days is $2,945.73.
Ether’s price [-0.02%] closed its daily candle on Monday worth $3,520.39.
Cardano Analysis
Cardano’s price closed higher than the other two projects covered today and finished its daily session +$0.03. ADA’s price is +44.6% for the last 30 days, at the time of writing.
Today’s third chart is the ADA/USD 1D chart below from Crypto4Everybody. ADA’s price has spent much of the last few days bumping up against the 0.618 fib level [$1.19] and finally closed above it again on Monday.
For bullish Cardano traders, they’re taking aim at breaking the 0.618 level with candle close confirmation. If they succeed at that level the next target is 0.5 [$1.52] which is a major level of inflection on the daily timescale.
Bearish ADA traders are conversely looking to retest 2022’s lows just above the 0.786 [$0.70].
Cardano’s 24 hour price range is $1.17-$1.23 and its 7 day price range is $1.11-$1.23. ADA’s 52 week price range is $0.748-$3.09.
ADA’s Moving Averages: 5-Day [$1.18], 20-Day [$0.98], 50-Day [$1.00], 100-Day [$1.21], 200-Day [$1.59], Year to Date [$1.06].
Cardano’s price is +0.77% against The U.S. Dollar for the last 12 months, +25.99% against BTC, and -40.12% against ETH over the same duration, at the time of writing.
Cardano’s price on this date last year was $1.18.
The average price of ADA over the last 30 days is $2,945.73.
Cardano’s price [+2.39%] closed its daily session worth $1.21 on Monday and in green digits for a second straight day.
Source: https://en.cryptonomist.ch/2022/04/05/bitcoin-46k-ethereum-3-4k-cardano-price-analyses/


