Bitcoin Analysis
Bitcoin’s price closed Sunday’s daily session in green figures and broke up four days of consecutive selling pressure from bearish traders. BTC closed Sunday’s daily candle +$133.2.
The first chart we’re leading our price analyses off with this week is the BTC/USD 4HR chart below from Auronex. BTC’s price is trading between 0.236 [$20,982.44] and 0.382 [$23,238.61], at the time of writing.
The short-term overhead targets for bullish BTC traders are 0.382, 0.5 [$25,062.08], and 0.618 [$26,885.56].
Bearish BTC traders are seeking a reversal to the downside and are eying the 0.236 level firstly with a secondary target of a full retracement at 0 [$17,335.48].
Bitcoin’s Moving Averages: 5-Day [$22,759.92], 20-Day [$20,926.36], 50-Day [$24,599.34], 100-Day [$32,374.48], 200-Day [$40,909.66], Year to Date [$35,057.11].
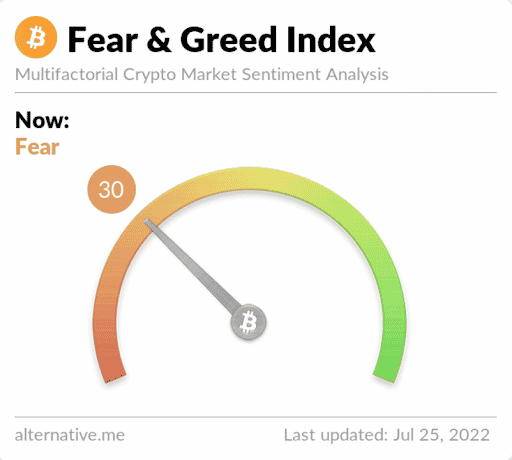
The Fear and Greed Index is 30 Fear and is even to Sunday’s reading.

BTC’s 24 hour price range is $22,261-$23,006 and its 7 day price range is $20,806-$24,160. Bitcoin’s 52 week price range is $17,611-$69,044.
The price of Bitcoin on this date last year was $35,407.
The average price of BTC for the last 30 days is $21,039.02 and its +7.2% over the same duration.
Bitcoin’s price [+0.59%] closed its daily candle worth $22,579.2 on Sunday.
Ethereum Analysis
Ether’s price also climbed higher on Sunday and wrapped-up its daily session +$48.66.
The second chart we’re analyzing this Monday is the ETH/USD 4HR chart below Big_Mike716. Ether’s outperformed BTC by 23.53% over the last 30 days and bulls are hoping to eclipse the 2.618 [$1,527.13] level next.
Bearish Ether traders are conversely looking to push ETH’s price back below 1.618 [$1,527.13]. The second target for bearish traders is 1 [$1,398.61] followed by a third target to the downside of 0.786 [$1,354.11].
Ether’s Moving Averages: 5-Day [$1,533.06], 20-Day [$1,242.36], 50-Day [$1,481.29], 100-Day [$2,188.16], 200-Day [$2,916.89], Year to Date [$2,424.85].
ETH’s 24 hour price range is $1,545.67-$1,664.34 and its 7 day price range is $1,359.22-$1,664.34. Ether’s 52 week price range is $883.62-$4,878.
The price of ETH on this date in 2021 was $2,190.59.
The average price of ETH for the last 30 days is $1,256.4 and its +39.2% over the same time frame.
Ether’s price [+3.14%] closed its daily candle on Sunday worth $1,598.22 and in green figures for a second consecutive day.
Cardano Analysis
Cardano’s price finished in negative figures on Sunday and -$0.005.
For the third chart today we’re analyzing the ADA/USD 1D chart from Trade_Journal.
Traders will note that ADA’s price is trading just above the heartline of the current descending channel that dates back to late 2021.
Cardano’s price is trading between two important levels. Bullish traders are seeking a return to the $0.64-$0.67 range.
Bearish ADA traders are conversely aiming to send ADA’s price back below the heartline and back down to test the $0.395-$0.43 range.

Cardano’s Moving Averages: 5-Day [$0.49], 20-Day [$0.46], 50-Day [$0.50], 100-Day [$0.70], 200-Day [$1.07], Year to Date [$0.83].
Cardano’s 24 hour price range is $0.497-$0.536 and its 7 day price range is $0.455-$0.539. ADA’s 52 week price range is $0.4-$3.09.
Cardano’s price on this date last year was $1.22.
The average price of ADA over the last 30 days is $0.47 and its +8.89% over the same timespan.
Cardano’s price [-0.97%] closed its daily session worth $0.512 on Sunday and in red figures for the second time over the last three days.
Source: https://en.cryptonomist.ch/2022/07/25/bitcoin-22k-ethereum-1-5k-cardano-price-analyses/

