Bitcoin Analysis
Bitcoin’s price finished in green figures by less than 1% on Monday and concluded its daily session +$23.90.
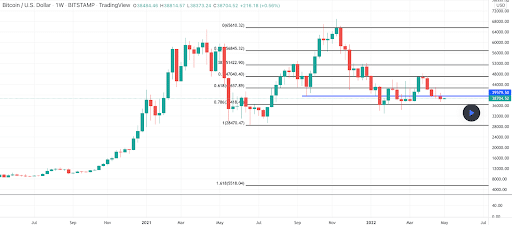
The first chart we’re analyzing today is the BTC/USD 1W chart below from Abdullahi2021. BTC’s price is trading between the 0.786 fibonacci level [$36,418.40] and 0.618 [$42,657.89], at the time of writing.
The targets for bullish BTC traders are 0.618, 0.5 [$47,040.40], 0.382 [$51,422.90] and 0.236 [$56,845.32].
If bearish traders get their way and can continue the larger downtrend their targets are 0.786, and 1 [$28,470.47].
The Fear and Greed Index is 27 Fear and is -1 from Monday’s reading of 28 Fear.

Bitcoin’s Moving Averages: 5-Day [$38,885.44], 20-Day [$40,761.05], 50-Day [$41,460.17], 100-Day [$42,337.96], 200-Day [$47,075.24], Year to Date [$41,337.08].
BTC’s 24 hour price range is $37,840-$39,132 and its 7 day price range is $37,777-$40,606. Bitcoin’s 52 week price range is $29,341-$69,044.
The price of bitcoin on this date last year was $57,200.
The average price of BTC for the last 30 days is $41,085.
Bitcoin’s price [+0.06%] closed its daily candle worth $38,520 on Monday and in green figures for a second straight day.
Ethereum Analysis
Ether’s price outpaced bitcoin for the second day in a row by percentage and ETH concluded its daily session +$30.34.
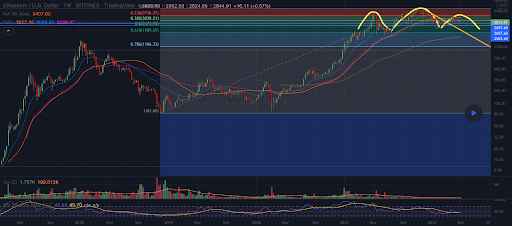
The second chart we’re looking at today is the ETH/USD 1W chart below by Cheesy-Bean_and_Rice-Burrito. Ether’s price is trading between 0.5 [$2,473.95] and 0.382 [$3,038.21], at the time of writing.
Overhead targets for bullish ETH traders are 0.382 followed by 0.236 [$3,736.37].
The targets below for bearish Ether market participants are 0.5, 0.618 [$1,909.69], and 0.786 [$1,106.33].
Ether’s Moving Averages: 5-Day [$2,852.20], 20-Day [$3,035.65], 50-Day [$2,953.40], 100-Day [$3,107.35], 200-Day [$3,381.66], Year to Date [$2,973.49].
ETH’s 24 hour price range is $2,761-$2,873 and its 7 day price range is $2,738-$3,016. Ether’s 52 week price range is $1,719-$4,878.
The price of ETH on this date in 2021 was $3,439.
The average price of ETH for the last 30 days is $3,065.60.
Ether’s price [+1.07%] closed its daily candle on Monday worth $2,855.98 and in green figures for a second consecutive day.
Polkadot Analysis
Polkadot’s price failed to get the price lift that BTC and ETH received from bullish bidders on Monday and wrapped up Monday’s daily session -$0.398.
The third chart we’re looking at today is the DOT/USD 1W chart by YoungSlav. Traders can see that DOT’s price has broken a long-term trend line to the downside.

The fourth chart we’re looking at today is the DOT/USD 1D chart below from knownAccount84951. On the 1D chart DOT’s price is trading between the 0.786 fib level [$14.18] and 0.618 [$15.32].
The targets for bullish DOT traders on the daily timescale are 0.618, 0.5 [$16.12], 0.382 [$16.93].
Conversely, bearish DOT traders are eyeing a break of the 0.786 fib level followed by a target of 1 [$12.72].
Polkadot’s Moving Averages: 5-Day [$16.38], 20-Day [$18.21], 50-Day [$18.64], 100-Day [$21.03], 200-Day [$27.18], Year to Date [$20.01].
Polkadot’s 24 hour price range is $14.64-$15.57 and its 7 day price range is $14.57-$18.24. DOT’s 52 week price range is $10.37-$54.98.
Polkadot’s price on this date last year was $37.31.
The average price of DOT over the last 30 days is $18.51.
Polkadot’s price [-2.59%] closed its daily candle worth $14.97 and in red digits for the third time over the last four days on Monday.
Source: https://en.cryptonomist.ch/2022/05/03/bitcoin-ethereum-polkadot-analyses/


